This is a refine.bio normalized compendium comprised of all the samples from a species that we were able to process, aggregate, and normalize. Normalized compendia provide a snapshot of the most complete collection of gene expression that refine.bio can produce for each supported organism.
You can read more about how we process refine.bio compendia in our documentation.
This download includes a gene expression matrix and experiment and sample metadata for all samples from a given organism that are fit for inclusion in the normalized compendium.
-
The
aggregated_metadata.jsonfile contains experiment metadata and information about the transformation applied to the data. Specifically, thescale_byfield notes any row-wise transformation that was performed on the gene expression data. For normalized compendia, this value should always beNONE. -
The gene expression matrix is the tab-separated value (TSV) file that bears the species name. For example, if you have downloaded the zebrafish normalized compendium, you would find the gene expression matrix in the file
DANIO_RERIO/DANIO_RERIO.tsv. Note that samples are columns and rows are genes or features. This pattern is consistent with the input for many programs specifically designed for working with high-throughput gene expression data but may be transposed from what other machine learning libraries are expecting. -
Sample metadata (e.g. disease vs. control labels) are contained in the TSV file with
metadatain the filename as well as any JSON files. We apply light harmonization to some sample metadata fields, which are denoted byrefinebio_(refinebio_annotationsis an exception). The contents of a sample'srefinebio_annotationsfield include the submitter-supplied sample metadata. -
Experiment metadata (e.g., experiment title and description) are contained in JSON files with
metadatain the filename.
Please see our documentation for more details.
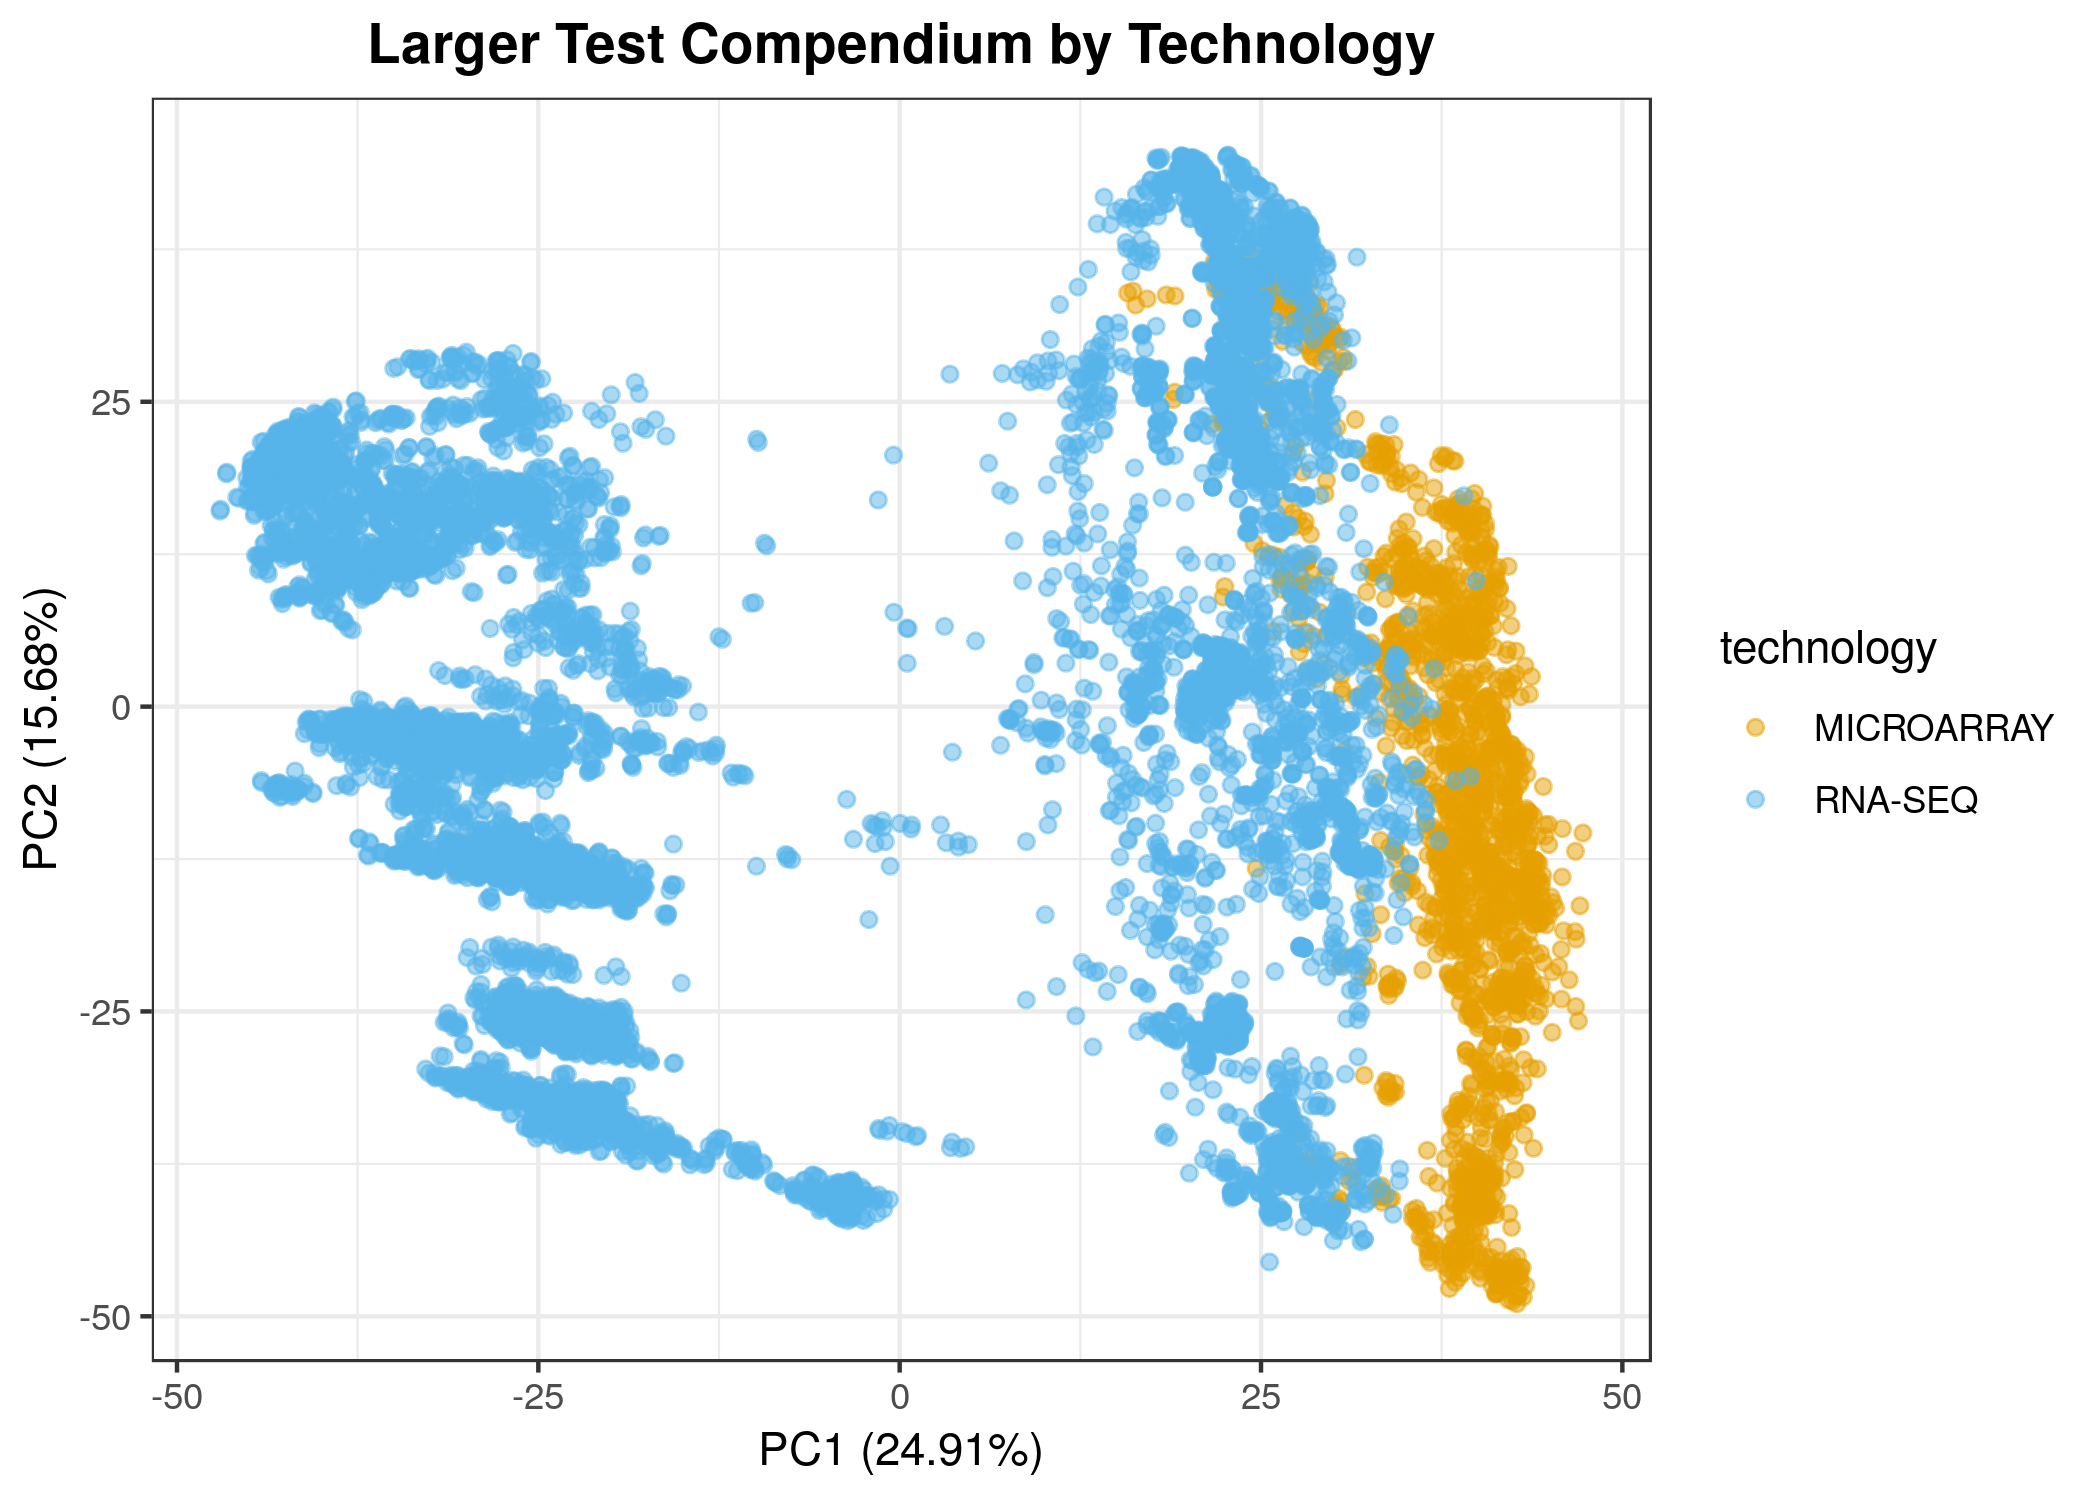
Combining all samples from a given species is a technical challenge, as it necessitates the integration of different microarray platforms and microarray data with RNA-seq data. Although the normalization steps we perform eliminate some sources of technical bias, it is imperfect and an active area of development. We strongly encourage you to consider using methods or models that can account for such biases and to explore and visualize the data with particular concern for samples' technology of origin (RNA-seq, microarray).
To identify appropriate methods for processing the initial releases of normalized compendia (described here), we performed a series of evaluations in a small zebrafish test compendium. We've made these evaluations available and have documented our rationale on GitHub here.
We have also performed exploratory analyses in a larger zebrafish test compendium (GitHub). We briefly summarize our findings below, including links to relevant notebooks or plots:
- Genes that are longer tend to have higher values in RNA-seq data as compared to microarray data (notebook).
- Unsurprisingly, shorter genes are less likely to be observed in RNA-seq data (notebook).
- Genes that are often zero in RNA-seq data have lower average expression in microarray data (notebook).
- We observe some differences in technology in the first two principle components, but there is also a group of RNA-seq samples that are different from all other samples (see below). These are samples from the Wellcome Sanger Institute Zebrafish Mutation Project (notebook).
The gene expression matrix TSV and JSON files can be read in, manipulated, or parsed with standard functions or libraries in the language of your choice. Below are some code snippets to help you import the data into R or Python and examine it.
Here's an example reading a gene expression TSV (GSE11111.tsv) into R as a data.frame with base R:
expression_df <- read.delim("GSE11111.tsv", header = TRUE,
							row.names = 1, stringsAsFactors = FALSE)
The rjson R package allows us to read a metadata JSON file (aggregated_metadata.json) into R as a list:
library(rjson)
metadata_list <- fromJSON(file = "aggregated_metadata.json")
In Python, we can read in the metadata JSON like so:
import json
with open('aggregated_metadata.json', 'r') as jsonfile:
    data = json.load(jsonfile)
print(data)
For example R workflows, such as clustering of gene expression data, please see our repository of example uses.
If you identify issues with this download, please file an issue on GitHub. If you would prefer to report issues via e-mail, you can also email requests@ccdatalab.org.
Please use the following:
Casey S. Greene, Dongbo Hu, Richard W. W. Jones, Stephanie Liu, David S. Mejia, Rob Patro, Stephen R. Piccolo, Ariel Rodriguez Romero, Hirak Sarkar, Candace L. Savonen, Jaclyn N. Taroni, William E. Vauclain, Deepashree Venkatesh Prasad, Kurt G. Wheeler. refine.bio: a resource of uniformly processed publicly available gene expression datasets. URL: https://www.refine.bio
Note that the contributor list is in alphabetical order as we prepare a manuscript for submission.