This document explains concepts and ideas behind Machine Learning and its types.

- Regression. Regression is a form of supervised machine learning in which the label predicted by the model is a numeric value. For example: based on historical data predict the number of sales of icecream for exact day based on weather, rain, humidity, day of the week, etc.
- Classification. Classification is a form of supervised machine learning in which the label represents a categorization, or class. There are two common classification scenarios.
- Binary classification determines whether the observed item is (or isn't) an instance of a specific class. Binary classification models predict one of two mutually exclusive outcomes, like "Whether a patient is at risk for diabetes based on clinical metrics like weight, age, blood glucose level".
- Multiclass classification. Multiclass classification extends binary classification to predict a label that represents one of multiple possible classes. For example, The species of a penguin (Adelie, Gentoo, or Chinstrap) based on its physical measurements.
- Clustering. The most common form of unsupervised machine learning is clustering. A clustering algorithm identifies similarities between observations based on their features, and groups them into discrete clusters.
Difference is the following: in Clustering ML you dont know the amount of classes, you are trying to group your elements based on their similarities.

- The training data consists of past observations
- An algorithm is applied to the data to try to determine a relationship between the features and the label, and generalize that relationship as a calculation that can be performed on x to calculate y
- y = f(x); The result of the algorithm is a model that encapsulates the calculation derived by the algorithm as a function
- Now that the training phase is complete, the trained model can be used for inferencing. The model is essentially a software program that encapsulates the function produced by the training process

- Split the training data (randomly) to create a dataset with which to train the model while holding back a subset of the data that you'll use to validate the trained model.
- Use an algorithm to fit the training data to a model. In the case of a regression model, use a regression algorithm such as linear regression.
- Use the validation data you held back to test the model by predicting labels for the features.
- Compare the known actual labels in the validation dataset to the labels that the model predicted. Then aggregate the differences between the predicted and actual label values to calculate a metric that indicates how accurately the model predicted for the validation data.
https://learn.microsoft.com/en-us/training/modules/fundamentals-machine-learning/4-regression


- One-vs-Rest (OvR) algorithms
- Multinomial algorithms
https://learn.microsoft.com/en-us/training/modules/fundamentals-machine-learning/7-clustering
One of the most commonly used algorithms is K-Means clustering, which consists of the following steps:
- The feature (x) values are vectorized to define n-dimensional coordinates (where n is the number of features). In the flower example, we have two features: number of leaves (x1) and number of petals (x2). So, the feature vector has two coordinates that we can use to conceptually plot the data points in two-dimensional space ([x1,x2])
- You decide how many clusters you want to use to group the flowers - call this value k. For example, to create three clusters, you would use a k value of 3. Then k points are plotted at random coordinates. These points become the center points for each cluster, so they're called centroids.
- Each data point (in this case a flower) is assigned to its nearest centroid.
- Each centroid is moved to the center of the data points assigned to it based on the mean distance between the points.
- After the centroid is moved, the data points may now be closer to a different centroid, so the data points are reassigned to clusters based on the new closest centroid.
- The centroid movement and cluster reallocation steps are repeated until the clusters become stable or a predetermined maximum number of iterations is reached.
- CNN architectures usually include multiple convolutional filter layers and additional layers to reduce the size of feature maps, constrain the extracted values, and otherwise manipulate the feature values. These layers have been omitted in this simplified example to focus on the key concept, which is that filters are used to extract numeric features from images, which are then used in a neural network to predict image labels.
- CNNs have been at the core of computer vision solutions for many years. While they're commonly used to solve image classification problems as described previously, they're also the basis for more complex computer vision models. For example, object detection models combine CNN feature extraction layers with the identification of regions of interest in images to locate multiple classes of object in the same image.
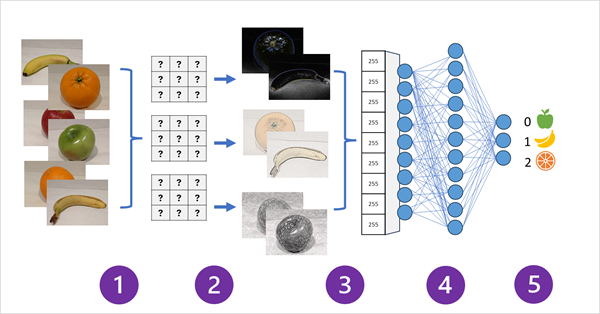
- Images with known labels (for example, 0: apple, 1: banana, or 2: orange) are fed into the network to train the model.
- One or more layers of filters is used to extract features from each image as it is fed through the network. The filter kernels start with randomly assigned weights and generate arrays of numeric values called feature maps.
- The feature maps are flattened into a single dimensional array of feature values.
- The feature values are fed into a fully connected neural network.
- The output layer of the neural network uses a softmax or similar function to produce a result that contains a probability value for each possible class, for example [0.2, 0.5, 0.3].
Laplas Filter to find edges in contract. used in model's education


