⚠️ AI-generated draft — needs human validation
This issue was written by an AI agent from materials produced during the
hasadna Open Bus hackathon (July 2026). The underlying analysis was built fast,
under hackathon conditions, and has not been peer-reviewed. Figures,
endpoint behaviour and conclusions all need independent verification before
anyone acts on them or quotes them publicly.
Please validate before implementing. Corrections very welcome.
What it answers
Which lines carry unusually many or few passengers for their peer group, at that hour? Raw counts cannot be compared across lines — a dense-city line and a suburban one differ for reasons unrelated to how well either runs. Scoring against peers means a low score reads as "carries fewer riders than comparable lines at the same time of day", not merely "is a small line".
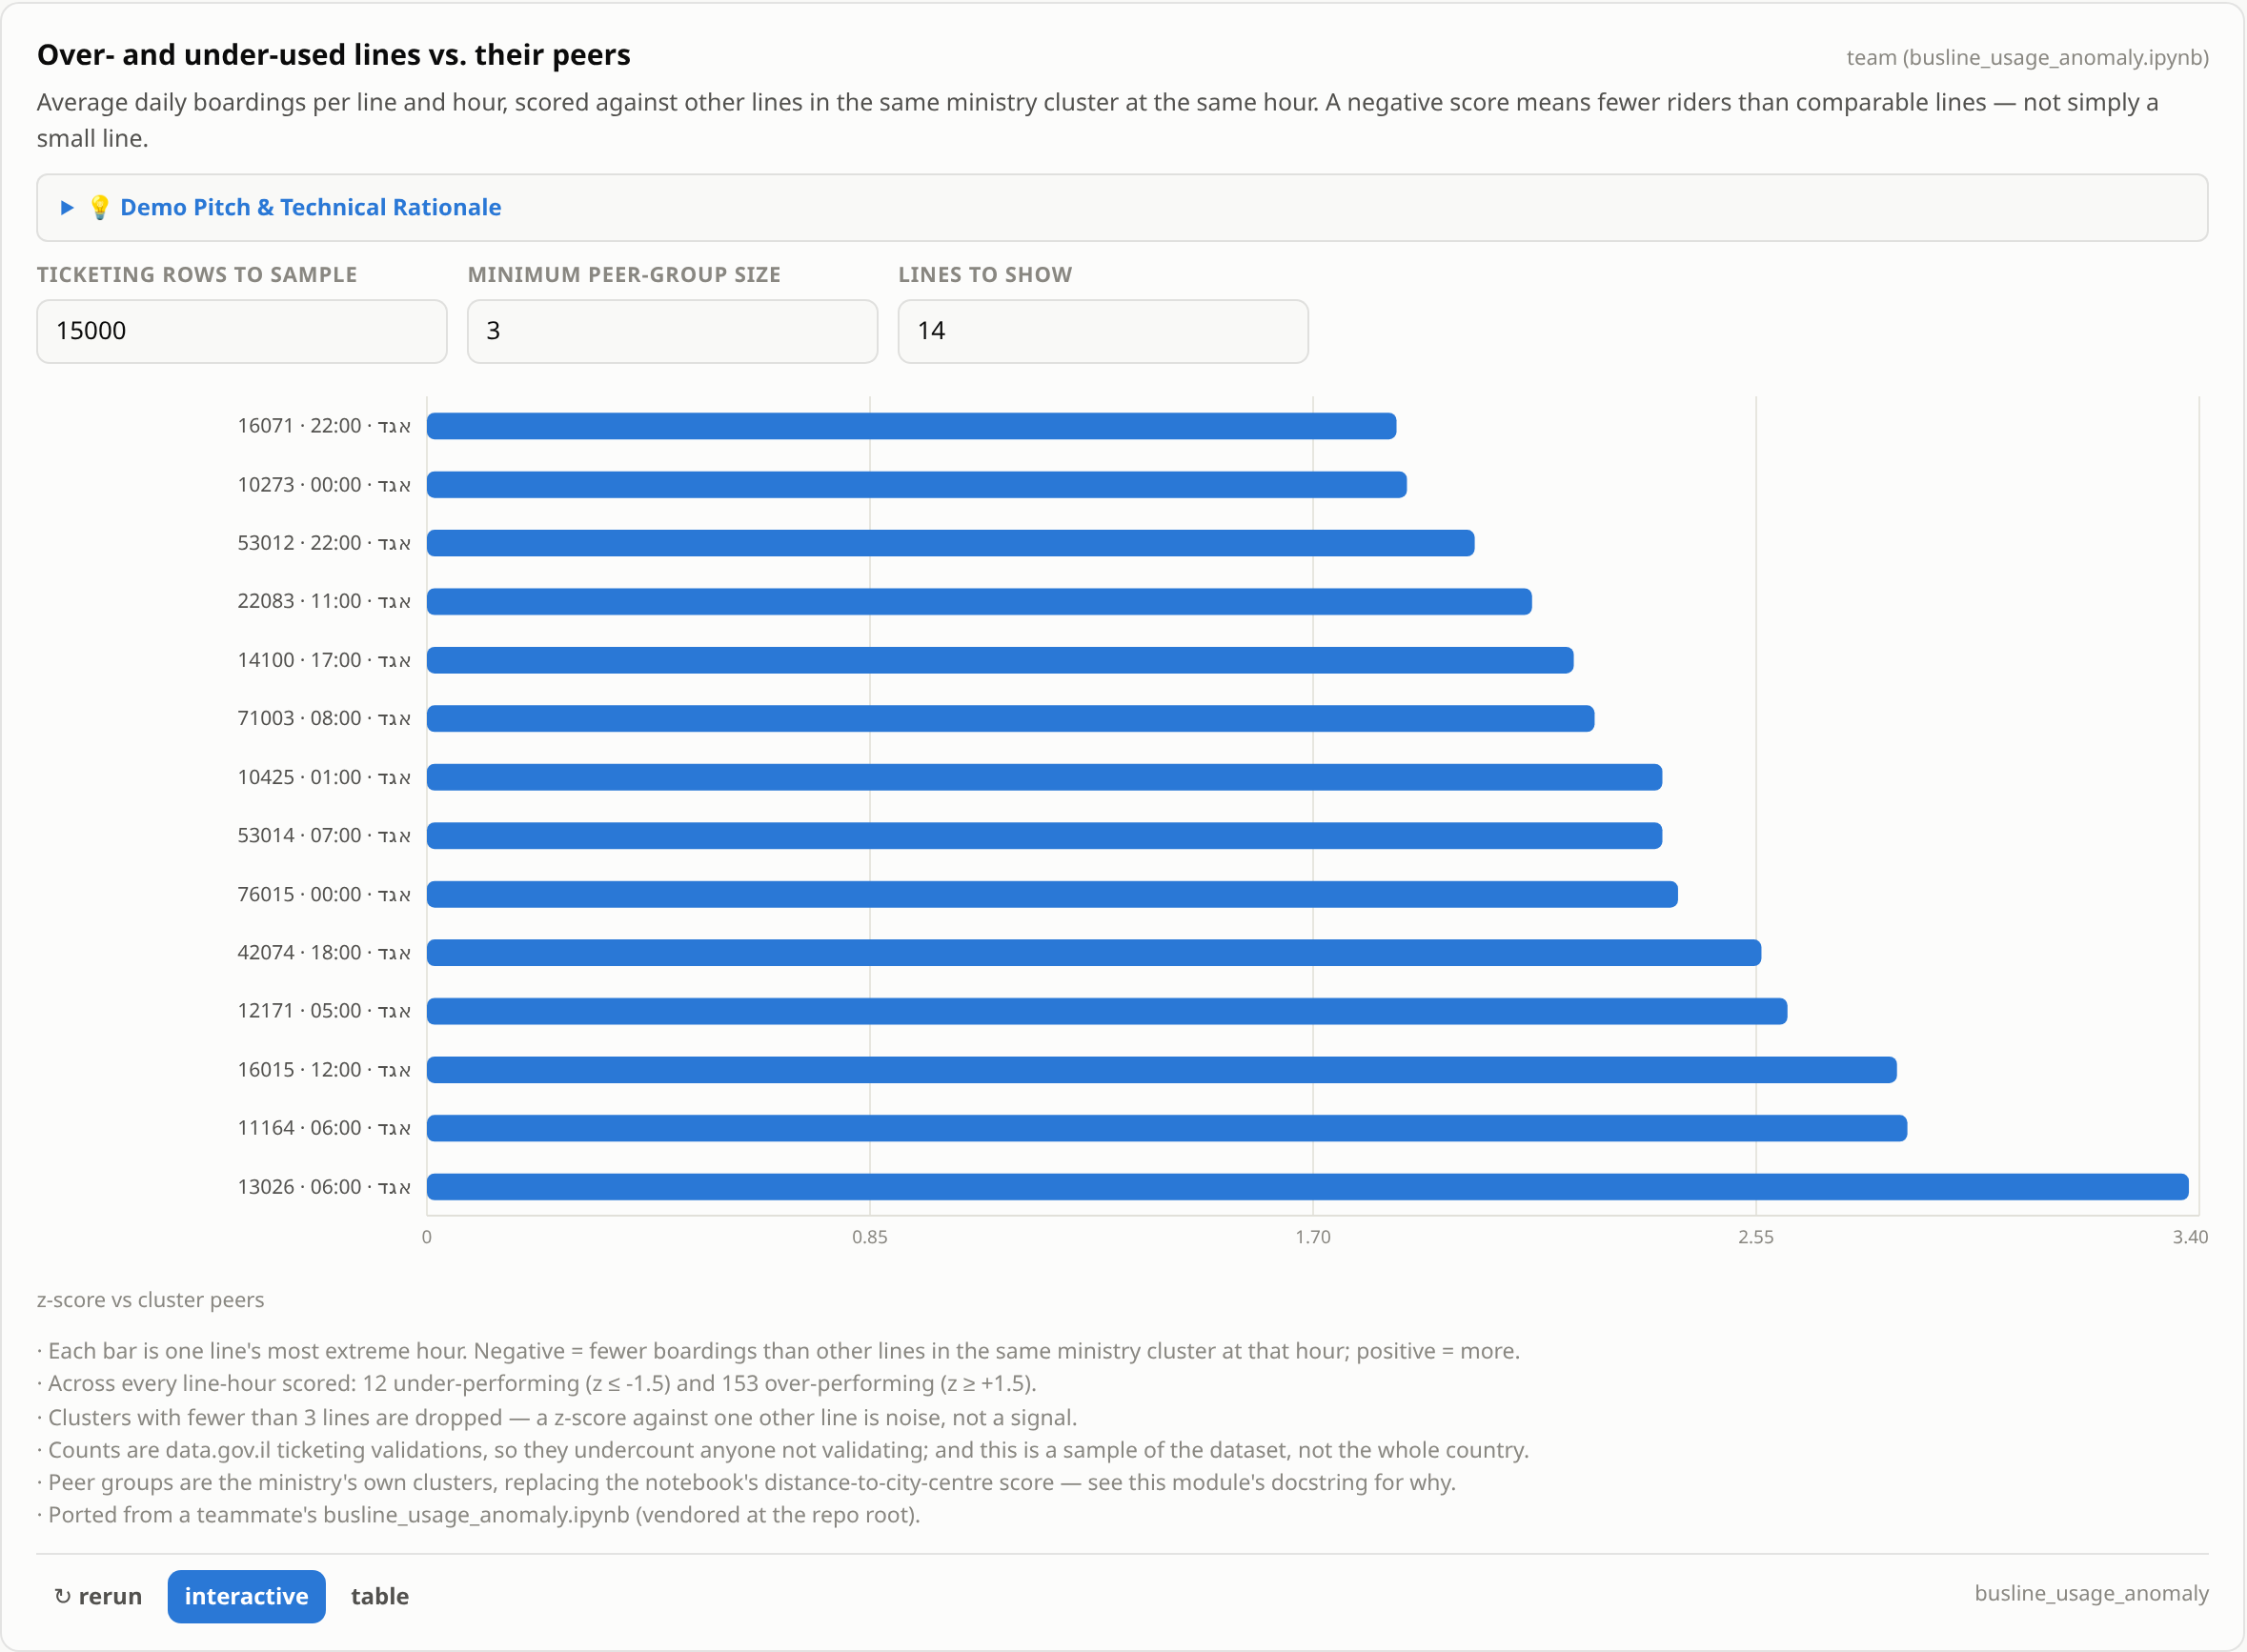
Ridership anomaly: lines carrying unusually few riders for their peer group — screenshot of the hackathon dashboard card.
How it works
- Page data.gov.il's hourly ticketing datastore (not Stride — this is the only
analysis on a different source).
- Each row is one line × direction × hour × month with
D1..D31 daily counts;
take the mean, skipping nulls.
- Drop the rail sentinel and undefined clusters; collapse direction and month.
- Group by the ministry's own
cluster_nm ("אשכול") and hour, then z-score each
line-hour against its peers.
- Drop peer groups below a minimum size — a z-score against one other line is noise.
Where it could go in דאטאבוס
/data-research — it is a different data source with different identifiers and does not fit the line/operator pickers.
A suggestion, not a decision — page ownership is the maintainers'.
Known limitations
Ticketing identifiers do not map to GTFS/SIRI line_ref or route_short_name, so this card sits in a silo and the global filters do not affect it — bridging that id mapping is the main blocker. The current "sample" takes the first N rows in dataset order, which is not random sampling. Z-scores also assume roughly normal peer distributions, while ridership is strongly right-skewed. Validation counts undercount anyone not validating.
Suggested next steps
Build the ticketing-id ↔ GTFS line_ref mapping first — that single piece of plumbing would let ridership be joined to reliability, which is the genuinely novel question: are the least reliable lines also the ones losing riders?
Status
The research is done and the numbers exist — a working implementation runs in the
hackathon repo against the live Stride API. What is missing is a production-shaped
version in this app.
Credit & provenance
Found during the hasadna Open Bus hackathon, July 2026 — analysis by the hackathon team.
· Method, evidence and caveats: algorithms/busline-usage-anomaly.md
· Original work: https://github.com/hasadna/open-bus-hackathon-26
· Issue drafts and the full defect list: algorithms/upstream-issues.md
What it answers
Which lines carry unusually many or few passengers for their peer group, at that hour? Raw counts cannot be compared across lines — a dense-city line and a suburban one differ for reasons unrelated to how well either runs. Scoring against peers means a low score reads as "carries fewer riders than comparable lines at the same time of day", not merely "is a small line".
Ridership anomaly: lines carrying unusually few riders for their peer group — screenshot of the hackathon dashboard card.
How it works
analysis on a different source).
D1..D31daily counts;take the mean, skipping nulls.
cluster_nm("אשכול") and hour, then z-score eachline-hour against its peers.
Where it could go in דאטאבוס
/data-research— it is a different data source with different identifiers and does not fit the line/operator pickers.A suggestion, not a decision — page ownership is the maintainers'.
Known limitations
Ticketing identifiers do not map to GTFS/SIRI
line_reforroute_short_name, so this card sits in a silo and the global filters do not affect it — bridging that id mapping is the main blocker. The current "sample" takes the first N rows in dataset order, which is not random sampling. Z-scores also assume roughly normal peer distributions, while ridership is strongly right-skewed. Validation counts undercount anyone not validating.Suggested next steps
Build the ticketing-id ↔ GTFS line_ref mapping first — that single piece of plumbing would let ridership be joined to reliability, which is the genuinely novel question: are the least reliable lines also the ones losing riders?
Status
The research is done and the numbers exist — a working implementation runs in the
hackathon repo against the live Stride API. What is missing is a production-shaped
version in this app.
Credit & provenance
Found during the hasadna Open Bus hackathon, July 2026 — analysis by the hackathon team.
· Method, evidence and caveats:
algorithms/busline-usage-anomaly.md· Original work: https://github.com/hasadna/open-bus-hackathon-26
· Issue drafts and the full defect list:
algorithms/upstream-issues.md