Release 3.4.0 - Line graphs & bugfix #472
mathoudebine
announced in
Announcements
Replies: 1 comment
-
|
Could you tell me whether this graph is able to display the actual frame time, allowing the current delays in milliseconds (‘ms’) to be monitored, similar to how MSI Afterburner + RTSS Rivatuner Statistics Server do it in the overlay? |
Beta Was this translation helpful? Give feedback.
0 replies
Sign up for free
to join this conversation on GitHub.
Already have an account?
Sign in to comment
Uh oh!
There was an error while loading. Please reload this page.
-
New feature: line graphs!
Thanks to @hicwic's PR #371 the System Monitor program now supports line graphs!

The line graph feature has been added to many metrics like: CPU/GPU/Disk/Memory usage, temperature, CPU Fan speed, FPS...
Check https://github.com/mathoudebine/turing-smart-screen-python/blob/main/res/themes/theme_example.yaml and look for
LINE_GRAPHkey:The history size (number of previous values displayed on the graph) can be adjusted for its data.
With
AUTOSCALE: Truethe line graph Y axis will constantly adjust to the min/max displayed values, otherwise setMIN_VALUE/MAX_VALUEfor a static Y axisGraph axis can be show or hidden with
AXIS: True/Falseand set to a specific color withAXIS_COLOR(default to theLINE_COLORif not set)New themes:
This release comes with 2 new themes that use the line graph functionality:
Cyberdeck theme (3.5 inch)
@hicwic released the theme he made for his Cyberdeck project
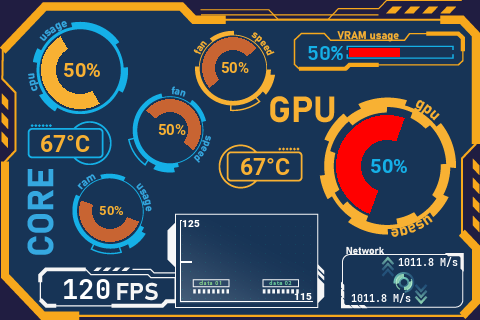
Check this discussion #374 for more details and final prototype!

Task Manager theme (5 inch)
This theme takes full advantage of the line graph feature, and is inspired by the (in)famous Windows Task Manager

Other fixes
This release also contain the following fixes:
What's Changed
New Contributors
Full Changelog: 3.3.4...3.4.0
This discussion was created from the release Release 3.4.0 - Line graphs & bugfix.
Beta Was this translation helpful? Give feedback.
All reactions