Window: last 7d (Aug 10–16, 2026) · vs prior 7d (Aug 3–9) · trend: last 18 days · generated 2026-08-16 · numbers are volume-weighted pooled counts (a low-build weekend day can't swing them — see note ▾)
📊 Are we improving?
Net: improving. The flagship 🔀 PR lane recovered to 79% (414/521, ▲18 WoW on 521 real runs) as last week's Aug 8–9 mass-failure event rolled into the prior window — this week ran healthy (95% Aug 11, 85% Aug 13, 79% Aug 14, 59% partial Aug 16). 🏗️ internal main held (80%, ▲1). The one drag is rolling red: 🌳 GH main fell to 27% (21/78, ▼29), red-heavy all week — but it's a low-volume no-rerun-net lane. Weighted toward the steady high-volume PR lane, the week is genuinely better; GH-main rolling red is the standing thing to watch.
|
Lane pass (same lanes & order as §🚦) |
prior 7d → this 7d |
Δ |
| ↓ |
🌳 GH main (rolling) pass |
56% → 27% |
▼29 (prior 28/50; this 21/78; rolling has no rerun net — swingy, red-heavy) |
| ↓ |
🌿 GH release/13.5 push pass |
50% → 46% |
▼4 (tiny n: 6/13; prior 1/2) |
| → |
🧪 GH outerloop main pass |
29% → 29% |
→0 (tiny n: 2/7; most recent scheduled run passed) |
| ↑ |
🏗️ Internal AzDO main pass |
79% → 80% |
▲1 (prior 19/24; this 33/41, 8 fails — holding) |
| ↑ |
🏗️ Internal release/13.5 pass |
0% → 69% |
new (tiny n: 9/13; prior 0/1) |
| ↑ |
🔀 PR validation pass |
61% → 79% |
▲18 (real volume: 414/521; prior window carried the Aug 8–9 collapse, now aged out) |
| ⚪ |
broken backlog |
ciinsights blind since ~Jun 30 (~47d) — can't confirm |
last-known retained slice (≤ Jun 30): CLI-E2E + conformance + Hosting-provider families |
🚦 Pass rate by lane
Outerloop-release omitted — no scheduled runs on release/13.5.
🧱 infra share: n/a fresh this window — ciinsights ingested no Jul/Aug builds (newest ~Jun 30), so an in-window infra/test split can't be computed. Last-known standing pattern (retained slice ≤ Jun 30): ~74% of failed builds were environmental timeout-style infra, not product regressions. Details ▾.
📈 Trend — pass rate over the last ~18 days
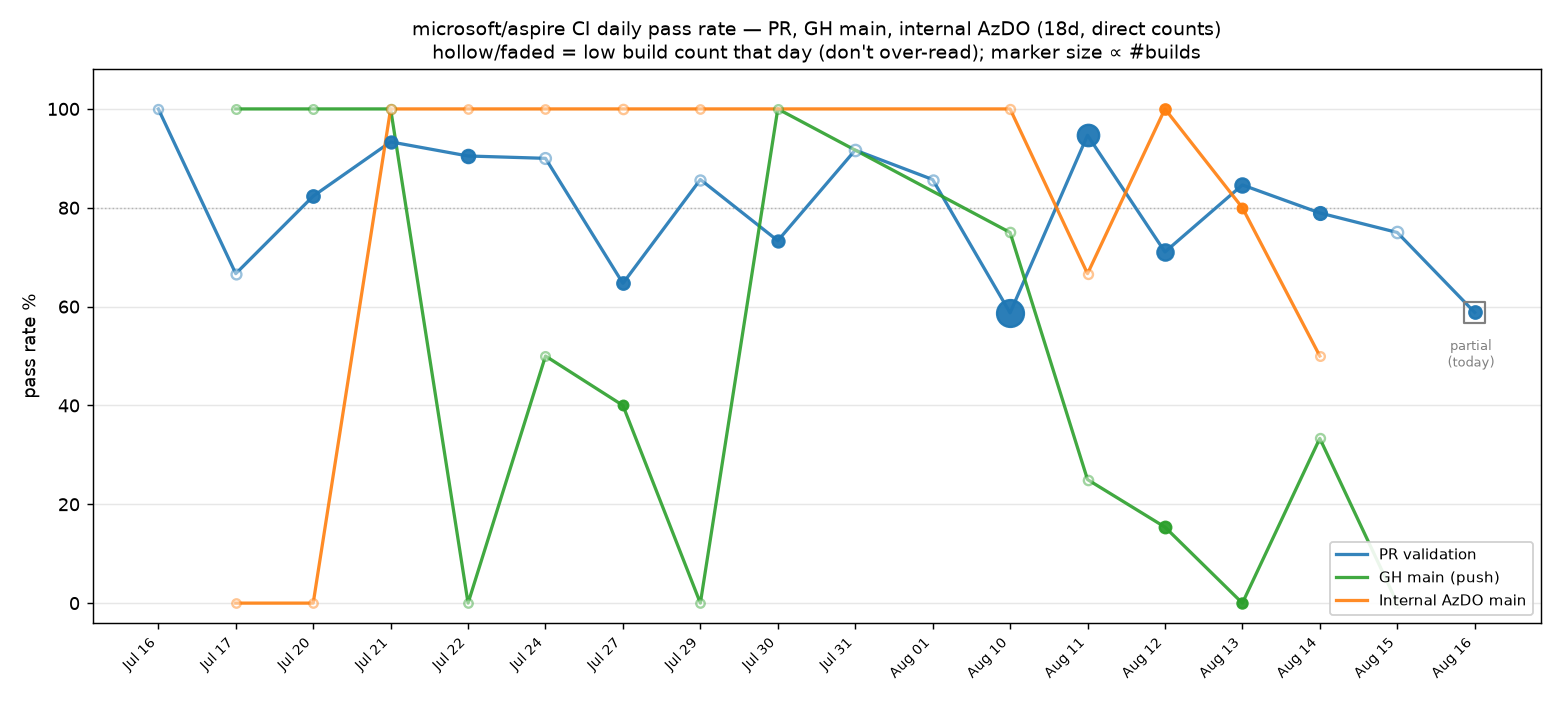
Three lanes on the same direct gh-run/AzDO basis. Low-build days are drawn hollow/faded and marker size ∝ #builds, so a 1–2 build day doesn't read as a real swing. Aug 16 (rightmost, boxed) is a partial day — ignore its position. This tier recomputes only the day it runs and freezes prior published days, so Aug 02–09 have no per-day rows (no weekly run landed on them); the trend picks up again at Aug 10. 🔵 PR validation recovered (79% pooled; 85% Aug 13, 79% Aug 14). 🟢 GH main swings on few builds/day and is red-heavy this week (27% pooled; 0/7 Aug 13). 🟠 internal AzDO main held (80%; the Aug 14 dip is a 1/2 tiny-n day).
📅 Per-day numbers — PR, GH main, internal AzDO main (newest first)
| Day |
🔀 PR validation |
🌳 GH main |
🏗️ Internal main |
Aug 16 |
59% (10/17) |
— |
— |
Aug 15 |
75% (9/12) |
0% (0/3) |
— |
Aug 14 |
79% (15/19) |
33% (1/3) |
50% (1/2) |
Aug 13 |
85% (22/26) |
0% (0/7) |
80% (4/5) |
Aug 12 |
71% (27/38) |
15% (2/13) |
100% (8/8) |
Aug 11 |
95% (71/75) |
25% (1/4) |
67% (2/3) |
Aug 10 |
59% (74/126) |
75% (3/4) |
100% (3/3) |
Aug 01 |
86% (6/7) |
— |
— |
Jul 31 |
92% (11/12) |
— |
— |
Jul 30 |
73% (11/15) |
100% (2/2) |
— |
Jul 29 |
86% (6/7) |
0% (0/1) |
100% (1/1) |
Jul 27 |
65% (11/17) |
40% (2/5) |
100% (4/4) |
Jul 24 |
90% (9/10) |
50% (1/2) |
100% (1/1) |
Jul 22 |
90% (19/21) |
0% (0/1) |
100% (1/1) |
Jul 21 |
93% (14/15) |
100% (3/3) |
100% (3/3) |
Jul 20 |
82% (14/17) |
100% (2/2) |
0% (0/1) |
Jul 17 |
67% (4/6) |
100% (2/2) |
0% (0/1) |
Jul 16 |
100% (3/3) |
— |
— |
Direct counts (completed runs, success/(success+failure)); internal counts "partially succeeded" as success. Italic = low build count that day — read directionally. Today's row (Aug 16) recomputed this run; earlier PR/main/internal cells frozen verbatim (first-computation snapshots, so a frozen cell like Aug 11 PR 71/75 — a partial snapshot from an earlier run — won't match its fuller fresh-fetch count and need not sum to the §3 pooled headline). Aug 02–09 have no rows (no weekly run landed on them). Oldest day rolls off at ~18 rows.
⏱️ Build times — by pipeline
p50/p95 over the same completed-run set as pass rate; PR and push cohorts kept separate (never averaged).
| Pipeline |
p50 (this wk) |
p95 (this wk) |
Δ p50 vs prior wk |
| 🌳 GH CI — main (push) |
50m |
80m |
▲ 15m (was 35m) |
| 🌿 GH CI — release/13.5 (push) |
31m |
53m |
▼ 11m (was 42m, prior n=2) |
| 🏗️ Internal (AzDO) — main |
83m |
124m |
▲ 4m (was 79m) |
| 🏗️ Internal (AzDO) — release/13.5 |
80m |
154m |
new (n=13; prior n=1) |
GH durations: run_started_at→updated_at. Internal: startTime→finishTime. GH main p50 is 50m (▲15m WoW) — tracking the red-heavy main runs this week (red runs that ran the full matrix before failing are slower than a clean pass); p95 a tame 80m. Internal main p50 flat (79m→83m), p95 steady at 124m. release/13.5 rows have thin/absent prior baselines (2 GH-push, 1 internal last week) — read the Δ directionally. PR validation build time is intentionally excluded: ci.yml on pull_request is only the short gating workflow — the real PR test work runs in separately-triggered workflows it doesn't wait on — so its run duration is not end-to-end PR CI time and there is no cheap accurate figure. (PR-validation pass rate still appears in §2/§3.)
🔧 Triage worklist — fix these first
⚠️ This entire list is STALE and NOT confirmable this run — ciinsights's newest ingested test failure is ~Jun 30 (~47 days; the whole Jul 1–Aug 16 window unseen). A 7d / 30d health-summary returns 0 builds (get_flagged_tests → no_builds); a ~75d query times out. The families below are the last retained slice (all last-failed Jun 28–30); ciinsights cannot tell us whether they are fixed, stopped running, or simply un-ingested. Do not treat any row as live work — every row is ≥47 days stale, so all need "confirm fixed vs stopped running." The reliable signal this week is the lane pass rates (§2/§3), sourced from gh/az directly: PR 79% (healthy all week, 85% Aug 13), GH-main 27% (red-heavy), outerloop 2/7 (most recent run passed), internal 80%.
| Severity |
fails (retained, ≤ Jun 30) |
Test |
Last failed |
| 🔴 broken (stale?) |
~1300+ fails (100%), 58 tests |
Aspire.Cli.EndToEnd / Tests harness — Ollama, OtelLogs, Describe/ResourceCommand, LogsCommand, AgentMcp, Smoke LatestCli, StopNonInteractive, EmptyAppHostTemplate…; all fail the CLI E2E automation harness = shared harness root cause. Freshest family (Jun 30). |
Jun 30 ⚠️ ~47d — confirm fixed vs stopped |
| 🔴 broken (stale?) |
~180 fails (100%), 12 tests |
Conformance family across EFCore.SqlServer, Qdrant, RabbitMQ, MongoDB and other providers — LoggerFactoryIsUsedByRegisteredClient, ServiceLifetimeIsAsExpected, Tracing/HealthChecksRegisters…; same conformance-suite shape across providers = likely one shared fix, not per-provider. |
Jun 29 ⚠️ ~48d — confirm fixed vs stopped |
| 🔴 broken (stale?) |
~2000+ fails (100%), ~90 tests |
Aspire.Hosting. provider integration family* — MongoDB, Kubernetes/Helm, PostgreSQL, JavaScript, RabbitMQ, SqlServer, Python, MySql, Nats, Redis, Containers… broad container/integration outage across providers. Older edge (last Jun 28) — most likely already off if ingestion resumes. |
Jun 28 ⚠️ ~49d — confirm fixed vs stopped |
| 🟡 flaky |
— |
None flagged — get_flagged_tests returned 0 flaky / 0 broken with no_builds (7d window empty). The live flake proxy is the rerun volume (§9), which stayed elevated (469 bot reruns → 127 PRs rescued). |
n/a |
Counts are per-test failure totals over ciinsights' retained slice (all pre-window, ≤ Jun 30) on the query_test_failures 100%-rate basis. Rows group same-error families so one root cause is one row (fails summed across the grouped tests; family totals ~approximate as the slice is capped at the fetched page). Everything is 47–49d stale — treat as leads to confirm (fixed vs stopped running), not live work. Distinct root causes → triage separately.
📖 Dominant story & week-over-week detail — flagship PR lane recovered (79%, ▲18) as the Aug 8–9 collapse aged out; GH-main rolling red (27%, ▼29); ciinsights blind ~47 days
This week's dominant story is the PR lane's recovery — 61%→79% (▲18) on 521 runs. Most of that lift is the Aug 8–9 mass-failure event rolling out of the this-7d window (it now sits in the prior window and drags its 61%), but the this-week runs are genuinely healthy on their own terms: 95% Aug 11, 85% Aug 13, 79% Aug 14, 59% partial Aug 16. Weighted toward the highest-volume flagship lane, that recovery is what pins the verdict at improving rather than merely holding.
The thing that moved the wrong way is 🌳 GH main — 56%→27% (▼29). It was red-heavy all week (0/7 Aug 13) and swings on ~11 builds/day, so the pooled figure overstates a clean trend, but 27% over 78 runs is a genuinely weak rolling week, not pure noise — and rolling main has no rerun net, so a human has to notice. This is the standing action item now that the PR incident is behind us.
🧪 Outerloop main stayed thin and mostly red (2/7, flat WoW) but its most recent scheduled run passed. One green isn't a recovery, but it's a change of direction worth watching in the daily Pulse (#18232). 🏗️ Internal main held flat and healthy (79%→80%); its lone Aug 14 dip is a 1/2 tiny-n day, not a trend.
The flaky tax stayed elevated even as the lane recovered. Reruns rescued a large batch of PRs — 🤖 the auto-rerun bot fired 469 rerun attempts across 289 PR runs → 127 distinct PR branches rescued red→green, with 12 branches never going green despite reruns (see §9). Heavy rerun volume with a recovered pooled pass rate means the PR lane is absorbing normal-week flake/transient-infra automatically, not masking a mass regression this time.
ciinsights's newest ingested test failure is ~Jun 30 — ~47 days, spanning several weekly reports. A 7/30-day health-summary returns 0 builds (no_builds); a ~75d query times out. Every "broken" family (§🔧) is that retained slice and the entire Jul–Aug window is unseen; treat the backlog as unconfirmed, not cleared. §3 lane table and §4 per-day trend share one direct gh/az basis (they agree on method). With ciinsights blind, the rerun volume (§9) is the only live proxy for how much flake/transient-infra the PR lane is absorbing.
⚖️ Why a low-build weekend can't mislead the headline (weighting note)
The lane %s and WoW deltas are pooled counts — Σsuccess / Σtotal over the 7-day window — not an average of daily rates. So a quiet day contributes only its raw builds to a 521-build PR denominator, not a full "day." A quiet week can't swing a pooled figure the way it swings a single day's ratio.
Where low volume does distort is the per-day chart/grid: there a 1–2 build day reads as a full 0%/100% point. Handled visually — low-build days hollow/faded with marker size ∝ #builds, today's partial day boxed, low-build cells italicized. A faded point = "not enough signal," not a real swing. (This is why the release rows and the thin internal-main day cells are called tiny-n.)
(Considered but deferred: a 7-day trailing volume-weighted overlay line. More rigorous but adds a second line per lane and hurts readability; the pooled headline + low-n de-emphasis already remove the misleading-spike problem.)
🔁 Auto-rerun & the flaky tax — reruns rescued 134 distinct PR branches this week; 12 never went green
PR-validation reruns (run_attempt > 1, 7d):
- 🤖 Auto-rerun bot: 469 rerun attempts across 289 PR runs → 127 distinct PRs rescued red→green; 13 still red.
- 🧑 Human reruns: 97 rerun attempts across 41 PR runs → 17 distinct PRs rescued; 16 still red.
- 🔗 Combined: 146 distinct PR branches needed ≥1 rerun; 134 went green, 12 never went green (27 branches needed both bot + human).
Rerun volume stayed high even as the lane recovered — the flaky/transient tax the PR lane pays every week, mostly absorbed automatically. The 12 branches that never went green despite reruns are the residue of deterministic (non-flaky) failures that reruns can't fix. With ciinsights blind, this rerun volume is currently the only live proxy for how much flake/transient-infra the PR lane is absorbing. (Auto-rerun is PR-only; rolling main/release/outerloop-scheduled reds above are raw, un-rescued. Attribution reflects each run's latest attempt only; distinct-PR counts dedupe on head branch.)
🧱 Infrastructure failures — fresh share not computable (ciinsights blind, newest ~Jun 30); last-known ~74%
A fresh in-window infra share can't be computed this run — ciinsights, the source that classifies a failed build as infra vs test, has ingested no Jul/Aug builds (newest ~Jun 30) and returns 0 in-window builds. The standing pattern from its retained slice (≤ Jun 30) is unchanged: the majority of failed builds are environmental — long-duration timeout-style infra on genuine branches, mostly rescued on rerun, inflating the failed-build denominator but rarely blocking merge. Last-known figure: ~74% of failed builds over the retained set. That denominator is attempt-level and ends ~Jun 30, so do not read it as this week's rate. Group by base branch + job name before acting on any headline %. Once ingestion catches up, recompute the in-window share. (Source: ciinsights build-health failure breakdown over its rolling build set — a different, and currently stale, denominator than the per-lane counts above.)
Sources: ciinsights MCP/API (test/infra — blind this run: DB connected but no Jul/Aug builds ingested; newest test failure ~Jun 30, so 7/30d health-summaries return 0 builds / no_builds, a ~75d query times out; get_flagged_tests returned 0 flaky / 0 broken this run; last-known figures are from that retained ≤ Jun 30 slice, all on direct basis) + gh api .../ci.yml/runs (lane pass rates, rerun outcomes — complete, PR fetched per-date-bucketed and verified against each bucket to beat the 1000-run cap) + az pipelines (internal def 1602; counts only — complete). Lane %s are volume-weighted pooled counts. Lane table and per-day trend on one direct basis; PR/main/internal cells frozen pre-today (internal-main backfilled once then frozen). Retention ≈18d. Window = trailing 7d (Aug 10–16). Read-only report — no tests changed. What's on fire right now: see the daily CI Pulse (#18232). Generated 2026-08-16 19:16 UTC.
Window: last 7d (Aug 10–16, 2026) · vs prior 7d (Aug 3–9) · trend: last 18 days · generated 2026-08-16 · numbers are volume-weighted pooled counts (a low-build weekend day can't swing them — see note ▾)
📊 Are we improving?
Net: improving. The flagship 🔀 PR lane recovered to 79% (414/521, ▲18 WoW on 521 real runs) as last week's Aug 8–9 mass-failure event rolled into the prior window — this week ran healthy (95% Aug 11, 85% Aug 13, 79% Aug 14, 59% partial Aug 16). 🏗️ internal main held (80%, ▲1). The one drag is rolling red: 🌳 GH main fell to 27% (21/78, ▼29), red-heavy all week — but it's a low-volume no-rerun-net lane. Weighted toward the steady high-volume PR lane, the week is genuinely better; GH-main rolling red is the standing thing to watch.
🚦 Pass rate by lane
Outerloop-release omitted — no scheduled runs on release/13.5.
🧱 infra share: n/a fresh this window — ciinsights ingested no Jul/Aug builds (newest ~Jun 30), so an in-window infra/test split can't be computed. Last-known standing pattern (retained slice ≤ Jun 30): ~74% of failed builds were environmental timeout-style infra, not product regressions. Details ▾.
📈 Trend — pass rate over the last ~18 days
Three lanes on the same direct gh-run/AzDO basis. Low-build days are drawn hollow/faded and marker size ∝ #builds, so a 1–2 build day doesn't read as a real swing. Aug 16 (rightmost, boxed) is a partial day — ignore its position. This tier recomputes only the day it runs and freezes prior published days, so Aug 02–09 have no per-day rows (no weekly run landed on them); the trend picks up again at Aug 10. 🔵 PR validation recovered (79% pooled; 85% Aug 13, 79% Aug 14). 🟢 GH main swings on few builds/day and is red-heavy this week (27% pooled; 0/7 Aug 13). 🟠 internal AzDO main held (80%; the Aug 14 dip is a 1/2 tiny-n day).
📅 Per-day numbers — PR, GH main, internal AzDO main (newest first)
Aug 16Aug 15Aug 14Aug 13Aug 12Aug 11Aug 10Aug 01Jul 31Jul 30Jul 29Jul 27Jul 24Jul 22Jul 21Jul 20Jul 17Jul 16Direct counts (completed runs,
success/(success+failure)); internal counts "partially succeeded" as success. Italic = low build count that day — read directionally. Today's row (Aug 16) recomputed this run; earlier PR/main/internal cells frozen verbatim (first-computation snapshots, so a frozen cell like Aug 11 PR71/75— a partial snapshot from an earlier run — won't match its fuller fresh-fetch count and need not sum to the §3 pooled headline). Aug 02–09 have no rows (no weekly run landed on them). Oldest day rolls off at ~18 rows.⏱️ Build times — by pipeline
p50/p95 over the same completed-run set as pass rate; PR and push cohorts kept separate (never averaged).
GH durations:
run_started_at→updated_at. Internal:startTime→finishTime. GH main p50 is 50m (▲15m WoW) — tracking the red-heavy main runs this week (red runs that ran the full matrix before failing are slower than a clean pass); p95 a tame 80m. Internal main p50 flat (79m→83m), p95 steady at 124m. release/13.5 rows have thin/absent prior baselines (2 GH-push, 1 internal last week) — read the Δ directionally. PR validation build time is intentionally excluded:ci.ymlonpull_requestis only the short gating workflow — the real PR test work runs in separately-triggered workflows it doesn't wait on — so its run duration is not end-to-end PR CI time and there is no cheap accurate figure. (PR-validation pass rate still appears in §2/§3.)🔧 Triage worklist — fix these first
LatestCli, StopNonInteractive, EmptyAppHostTemplate…; all fail the CLI E2E automation harness = shared harness root cause. Freshest family (Jun 30).LoggerFactoryIsUsedByRegisteredClient,ServiceLifetimeIsAsExpected,Tracing/HealthChecksRegisters…; same conformance-suite shape across providers = likely one shared fix, not per-provider.get_flagged_testsreturned 0 flaky / 0 broken withno_builds(7d window empty). The live flake proxy is the rerun volume (§9), which stayed elevated (469 bot reruns → 127 PRs rescued).Counts are per-test failure totals over ciinsights' retained slice (all pre-window, ≤ Jun 30) on the
query_test_failures100%-rate basis. Rows group same-error families so one root cause is one row (fails summed across the grouped tests; family totals ~approximate as the slice is capped at the fetched page). Everything is 47–49d stale — treat as leads to confirm (fixed vs stopped running), not live work. Distinct root causes → triage separately.📖 Dominant story & week-over-week detail — flagship PR lane recovered (79%, ▲18) as the Aug 8–9 collapse aged out; GH-main rolling red (27%, ▼29); ciinsights blind ~47 days
This week's dominant story is the PR lane's recovery — 61%→79% (▲18) on 521 runs. Most of that lift is the Aug 8–9 mass-failure event rolling out of the this-7d window (it now sits in the prior window and drags its 61%), but the this-week runs are genuinely healthy on their own terms: 95% Aug 11, 85% Aug 13, 79% Aug 14, 59% partial Aug 16. Weighted toward the highest-volume flagship lane, that recovery is what pins the verdict at improving rather than merely holding.
The thing that moved the wrong way is 🌳 GH main — 56%→27% (▼29). It was red-heavy all week (0/7 Aug 13) and swings on ~11 builds/day, so the pooled figure overstates a clean trend, but 27% over 78 runs is a genuinely weak rolling week, not pure noise — and rolling main has no rerun net, so a human has to notice. This is the standing action item now that the PR incident is behind us.
🧪 Outerloop main stayed thin and mostly red (2/7, flat WoW) but its most recent scheduled run passed. One green isn't a recovery, but it's a change of direction worth watching in the daily Pulse (#18232). 🏗️ Internal main held flat and healthy (79%→80%); its lone Aug 14 dip is a 1/2 tiny-n day, not a trend.
The flaky tax stayed elevated even as the lane recovered. Reruns rescued a large batch of PRs — 🤖 the auto-rerun bot fired 469 rerun attempts across 289 PR runs → 127 distinct PR branches rescued red→green, with 12 branches never going green despite reruns (see §9). Heavy rerun volume with a recovered pooled pass rate means the PR lane is absorbing normal-week flake/transient-infra automatically, not masking a mass regression this time.
ciinsights's newest ingested test failure is ~Jun 30 — ~47 days, spanning several weekly reports. A 7/30-day health-summary returns 0 builds (
no_builds); a ~75d query times out. Every "broken" family (§🔧) is that retained slice and the entire Jul–Aug window is unseen; treat the backlog as unconfirmed, not cleared. §3 lane table and §4 per-day trend share one direct gh/az basis (they agree on method). With ciinsights blind, the rerun volume (§9) is the only live proxy for how much flake/transient-infra the PR lane is absorbing.⚖️ Why a low-build weekend can't mislead the headline (weighting note)
The lane %s and WoW deltas are pooled counts —
Σsuccess / Σtotalover the 7-day window — not an average of daily rates. So a quiet day contributes only its raw builds to a 521-build PR denominator, not a full "day." A quiet week can't swing a pooled figure the way it swings a single day's ratio.Where low volume does distort is the per-day chart/grid: there a 1–2 build day reads as a full 0%/100% point. Handled visually — low-build days hollow/faded with marker size ∝ #builds, today's partial day boxed, low-build cells italicized. A faded point = "not enough signal," not a real swing. (This is why the release rows and the thin internal-main day cells are called tiny-n.)
(Considered but deferred: a 7-day trailing volume-weighted overlay line. More rigorous but adds a second line per lane and hurts readability; the pooled headline + low-n de-emphasis already remove the misleading-spike problem.)
🔁 Auto-rerun & the flaky tax — reruns rescued 134 distinct PR branches this week; 12 never went green
PR-validation reruns (
run_attempt > 1, 7d):Rerun volume stayed high even as the lane recovered — the flaky/transient tax the PR lane pays every week, mostly absorbed automatically. The 12 branches that never went green despite reruns are the residue of deterministic (non-flaky) failures that reruns can't fix. With ciinsights blind, this rerun volume is currently the only live proxy for how much flake/transient-infra the PR lane is absorbing. (Auto-rerun is PR-only; rolling main/release/outerloop-scheduled reds above are raw, un-rescued. Attribution reflects each run's latest attempt only; distinct-PR counts dedupe on head branch.)
🧱 Infrastructure failures — fresh share not computable (ciinsights blind, newest ~Jun 30); last-known ~74%
A fresh in-window infra share can't be computed this run — ciinsights, the source that classifies a failed build as infra vs test, has ingested no Jul/Aug builds (newest ~Jun 30) and returns 0 in-window builds. The standing pattern from its retained slice (≤ Jun 30) is unchanged: the majority of failed builds are environmental — long-duration timeout-style infra on genuine branches, mostly rescued on rerun, inflating the failed-build denominator but rarely blocking merge. Last-known figure: ~74% of failed builds over the retained set. That denominator is attempt-level and ends ~Jun 30, so do not read it as this week's rate. Group by base branch + job name before acting on any headline %. Once ingestion catches up, recompute the in-window share. (Source: ciinsights build-health failure breakdown over its rolling build set — a different, and currently stale, denominator than the per-lane counts above.)
Sources: ciinsights MCP/API (test/infra — blind this run: DB connected but no Jul/Aug builds ingested; newest test failure ~Jun 30, so 7/30d health-summaries return 0 builds /
no_builds, a ~75d query times out;get_flagged_testsreturned 0 flaky / 0 broken this run; last-known figures are from that retained ≤ Jun 30 slice, all on direct basis) +gh api .../ci.yml/runs(lane pass rates, rerun outcomes — complete, PR fetched per-date-bucketed and verified against each bucket to beat the 1000-run cap) +az pipelines(internal def 1602; counts only — complete). Lane %s are volume-weighted pooled counts. Lane table and per-day trend on one direct basis; PR/main/internal cells frozen pre-today (internal-main backfilled once then frozen). Retention ≈18d. Window = trailing 7d (Aug 10–16). Read-only report — no tests changed. What's on fire right now: see the daily CI Pulse (#18232). Generated 2026-08-16 19:16 UTC.