Environment data
- debugpy version: 1.2.1
- OS and version: Windows 10 with latest updates
- Python version (& distribution if applicable, e.g. Anaconda): Python 3.7.9 official installer
- Using VS Code or Visual Studio: VS Code 1.53.1 64 bits extracted from zip
Actual behavior
VS Code does not stops at my breakpoints, nor from running from test tabs , nor trying to stepping into a file, nor running python -m debugpy and trying to attach to it.
Expected behavior
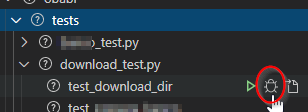
I want to be able to click in the highlighted icon below of one of my pytest unit tests:
and to have the debugger stop at this breakpoint:
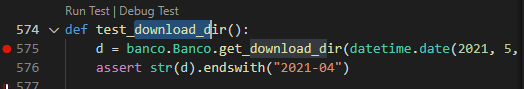
and be able to step through it.
Steps to reproduce:
I'm working inside a venv and its python exe is set as my VS Code python interpreter. Here is the venv installed packages.
Package                Version
---------------------- -------------------
appdirs                1.4.4
arrow                  0.17.0
attrs                  20.3.0
binaryornot            0.4.4
black                  19.10b0
brotlipy               0.7.0
certifi                2020.12.5
cffi                   1.14.3
chardet                3.0.4
click                  7.1.2
conda                  4.9.2
conda-package-handling 1.7.2
cookiecutter           1.7.2
cryptography           3.2.1
idna                   2.10
Jinja2                 2.11.2
jinja2-time            0.2.0
MarkupSafe             1.1.1
menuinst               1.4.16
mypy-extensions        0.4.3
pathspec               0.7.0
pip                    20.2.4
poyo                   0.5.0
pycosat                0.6.3
pycparser              2.20
pyOpenSSL              19.1.0
PySocks                1.7.1
python-dateutil        2.8.1
python-slugify         4.0.1
pywin32                227
regex                  2020.11.13
requests               2.24.0
rope                   0.18.0
ruamel-yaml            0.15.87
setuptools             50.3.1.post20201107
six                    1.15.0
text-unidecode         1.3
toml                   0.10.1
tqdm                   4.51.0
typed-ast              1.4.2
typing-extensions      3.7.4.3
urllib3                1.25.11
wheel                  0.36.2
win-inet-pton          1.1.0
wincertstore           0.2
I installed my module as editable running from inside the venv, in the root folder: pip install -e obabr
root is my workspace root folder. obabr is the name of the package I'm developing. My workspace is structured this way
root/obabr/
 |
 ------------> src/mypackage/*py
|
------------->tests/*_test.py
My setpup.py is in root/obabr/. This directory also has the file pytest.ini which content is:
[pytest]
norecursedirs =
    migrations

python_files =
    *_test.py
    tests.py
addopts =
    -ra
    --strict-markers
    --doctest-modules
    --doctest-glob=\*.rst
    --tb=short
testpaths =
    tests
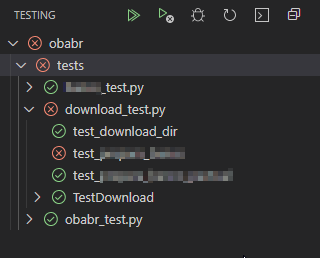
I can successfully run my tests from the VS Code test tab:
When I click in the debug icon of my breakpointed test, the VS Code status bar becomes orange, then becomes:

Here is the output of the debug console:
============================= test session starts =============================
platform win32 -- Python 3.7.9, pytest-6.2.0, py-1.10.0, pluggy-0.13.1
rootdir: c:\dev\ingest_oba, configfile: obabr\pytest.ini
plugins: hypothesis-6.0.3, forked-1.3.0, profiling-1.7.0, timeout-1.4.2, xdist-2.2.0
collected 1 item

obabr\tests\download_test.py .                                           [100%]

- generated xml file: C:\Users\ppppp\AppData\Local\Temp\tmp-15396J3k1TtjEH4i3.xml -
============================== 1 passed in 0.13s ==============================
And nothing happens. :-(
Trying to attach to debugpy module
If from my activated workspace in a _ bash shell_ I run the following command:
python -m debugpy --wait-for-client --listen 0.0.0.0:5678 ../../Scripts/pytest.exe download_test.py
and from the debug tab I try to connect using this configuration in my launch.json:
    "configurations": [
        {
            "name": "Python: Attach",
            "type": "python",
            "request": "attach",
            "connect": {
                "host": "localhost",
                "port": 5678
            }
        }
Then the test is executed, but my bookmarked command print(123) at top level of the test module does not stop. There are also other bookmarks inside my tests.
Trying a simple python file
It also fails the breakpoing if I put a bookmark in a simple .py file and try to debug with the following launch.json configuration:
        {
            "name": "Python: Arquivo Atual",
            "type": "python",
            "request": "launch",
            "program": "${file}",
            //"console": "integratedTerminal"
            "console": "internalConsole",
            "cwd": "${workspaceRoot}/obabr",
        }
I've tried some variations in this launch configuration, but nothing works.
I feel I'm really missing the full power of VS Code as a dev env.
Environment data
Actual behavior
VS Code does not stops at my breakpoints, nor from running from test tabs , nor trying to stepping into a file, nor running python -m debugpy and trying to attach to it.
Expected behavior
I want to be able to click in the highlighted icon below of one of my pytest unit tests:
and to have the debugger stop at this breakpoint:
and be able to step through it.
Steps to reproduce:
I'm working inside a venv and its python exe is set as my VS Code python interpreter. Here is the venv installed packages.
I installed my module as editable running from inside the venv, in the root folder:
pip install -e obabrrootis my workspace root folder.obabris the name of the package I'm developing. My workspace is structured this wayMy
setpup.pyis inroot/obabr/. This directory also has the filepytest.iniwhich content is:I can successfully run my tests from the VS Code test tab:
When I click in the debug icon of my breakpointed test, the VS Code status bar becomes orange, then becomes:
Here is the output of the debug console:
And nothing happens. :-(
Trying to attach to
debugpymoduleIf from my activated workspace in a _ bash shell_ I run the following command:
python -m debugpy --wait-for-client --listen 0.0.0.0:5678 ../../Scripts/pytest.exe download_test.pyand from the debug tab I try to connect using this configuration in my
launch.json:Then the test is executed, but my bookmarked command
print(123)at top level of the test module does not stop. There are also other bookmarks inside my tests.Trying a simple python file
It also fails the breakpoing if I put a bookmark in a simple .py file and try to debug with the following launch.json configuration:
I've tried some variations in this launch configuration, but nothing works.
I feel I'm really missing the full power of VS Code as a dev env.