-
Notifications
You must be signed in to change notification settings - Fork 7
New issue
Have a question about this project? Sign up for a free GitHub account to open an issue and contact its maintainers and the community.
By clicking “Sign up for GitHub”, you agree to our terms of service and privacy statement. We’ll occasionally send you account related emails.
Already on GitHub? Sign in to your account
Add n largest district heating systems as subnodes #147
base: main
Are you sure you want to change the base?
Conversation
for more information, see https://pre-commit.ci
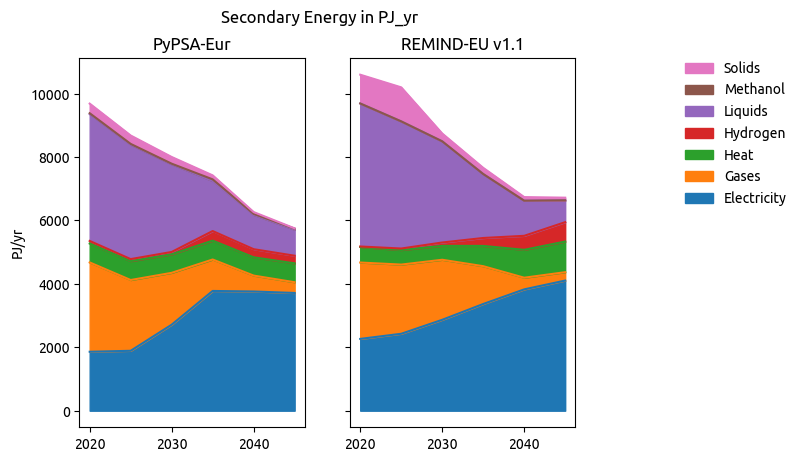
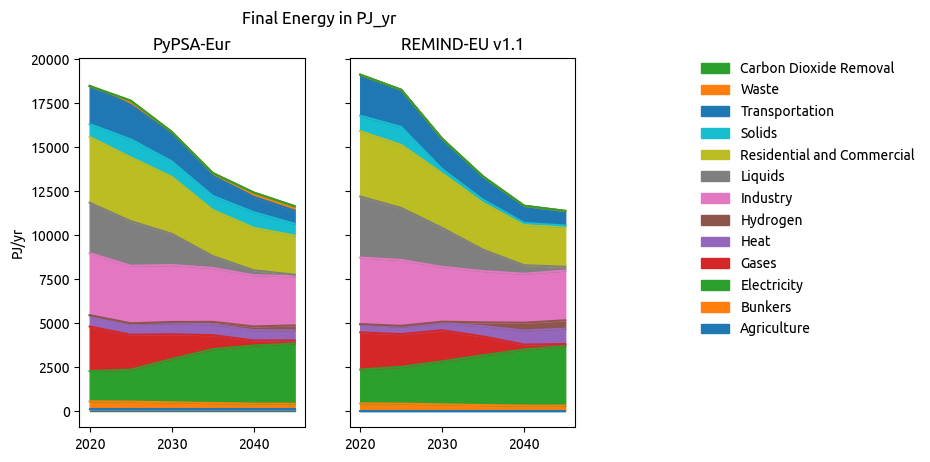
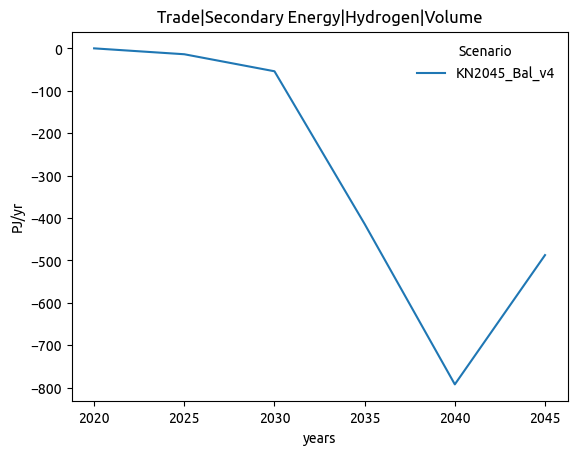
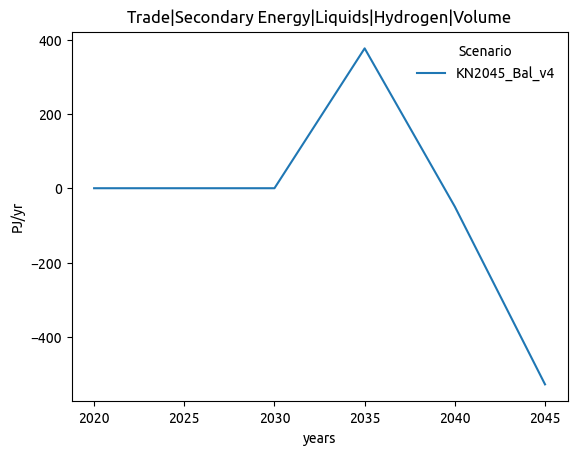
Validator ReportI am the Validator. Download all artifacts here.
|
| MAPE | |
|---|---|
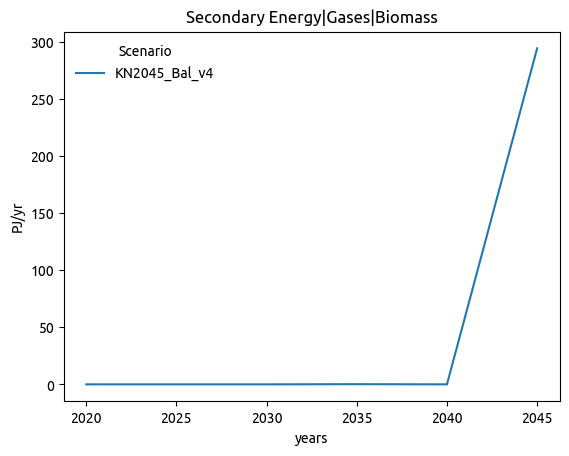
| Secondary Energy|Gases|Biomass | 2982966.88% |
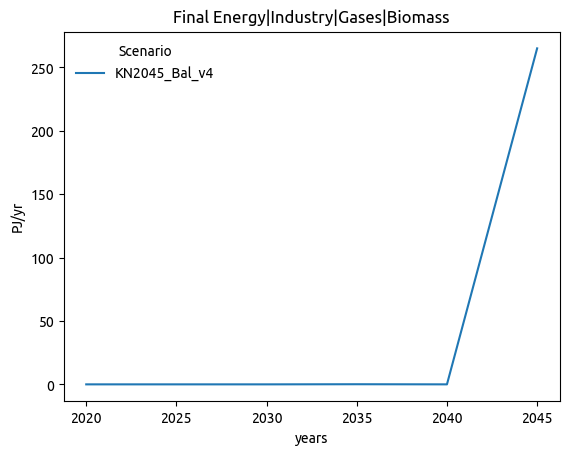
| Final Energy|Industry|Gases|Biomass | 2858548.62% |
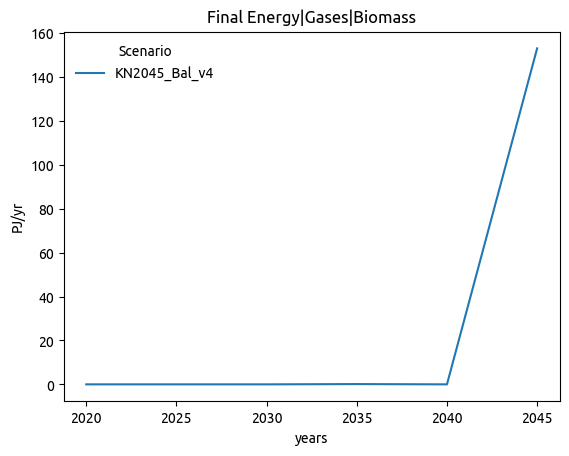
| Final Energy|Gases|Biomass | 2321177.93% |
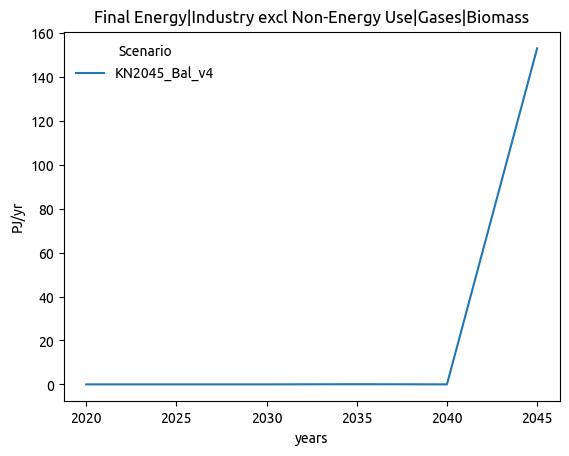
| Final Energy|Industry excl Non-Energy Use|Gases|Biomass | 2321177.86% |
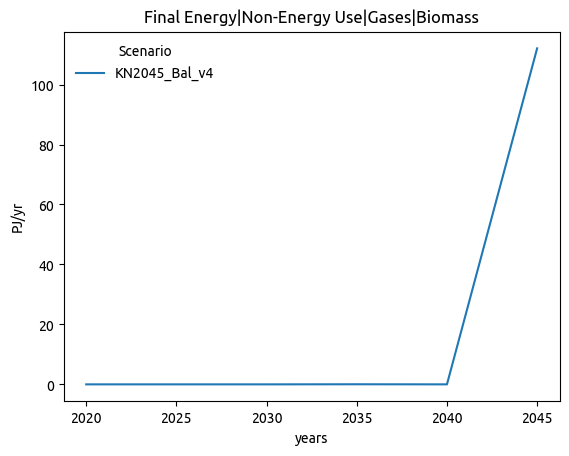
| Final Energy|Non-Energy Use|Gases|Biomass | 1632094.17% |
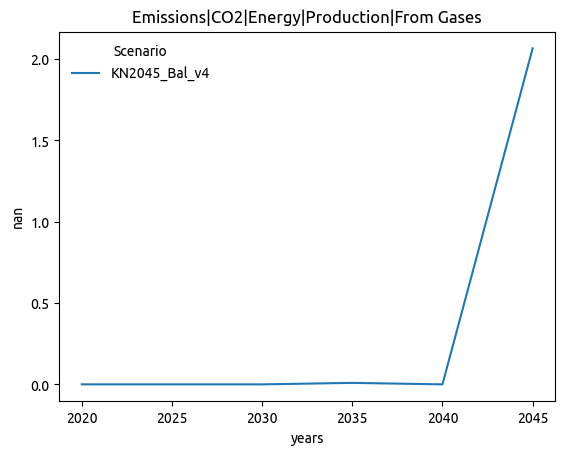
| Emissions|CO2|Energy|Production|From Gases | 44885.82% |
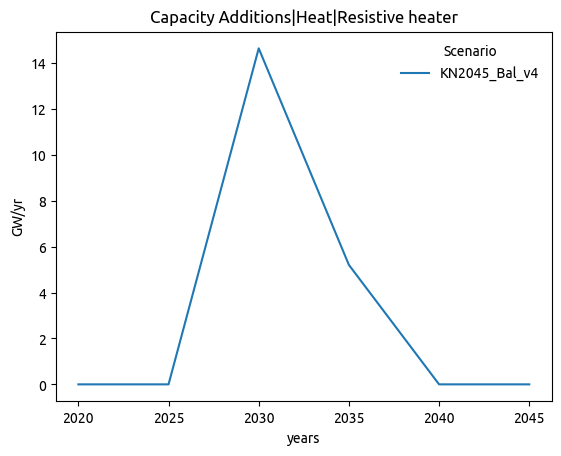
| Capacity Additions|Heat|Resistive heater | 8516.97% |
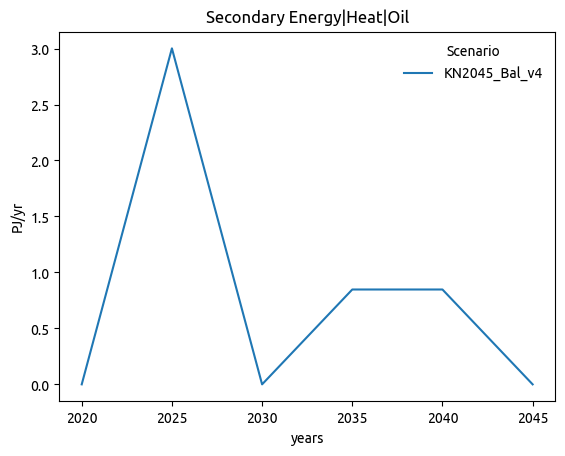
| Secondary Energy|Heat|Oil | 1684.71% |
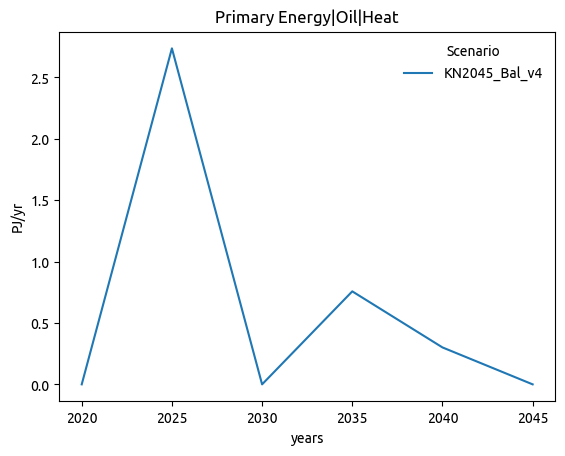
| Primary Energy|Oil|Heat | 1583.39% |
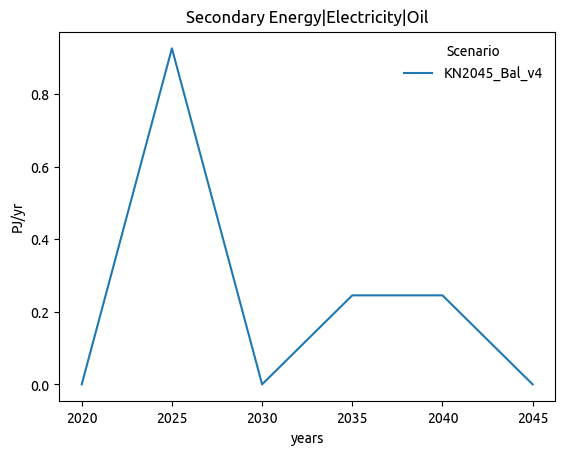
| Secondary Energy|Electricity|Oil | 1035.48% |
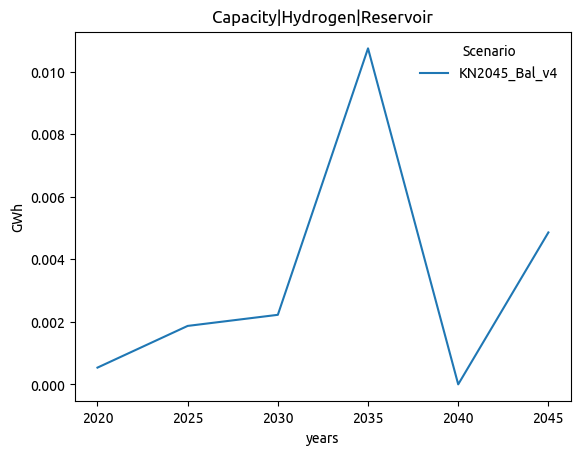
| Capacity|Hydrogen|Reservoir | 1002.31% |
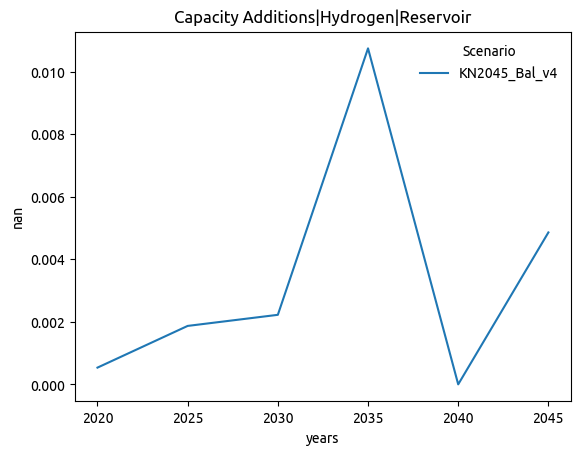
| Capacity Additions|Hydrogen|Reservoir | 1000.74% |
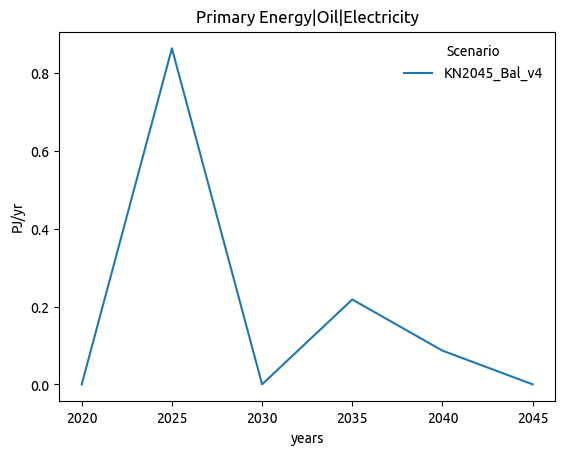
| Primary Energy|Oil|Electricity | 766.75% |
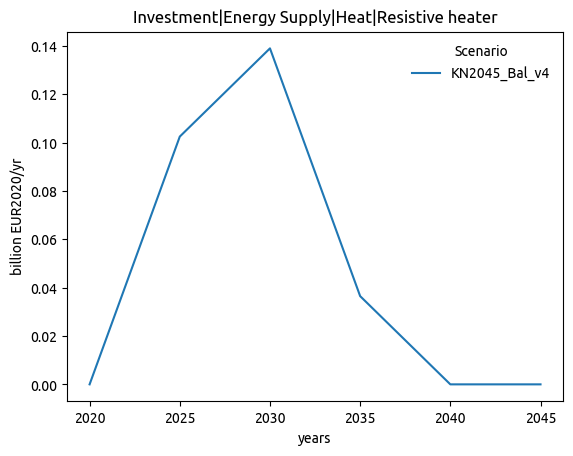
| Investment|Energy Supply|Heat|Resistive heater | 58.39% |
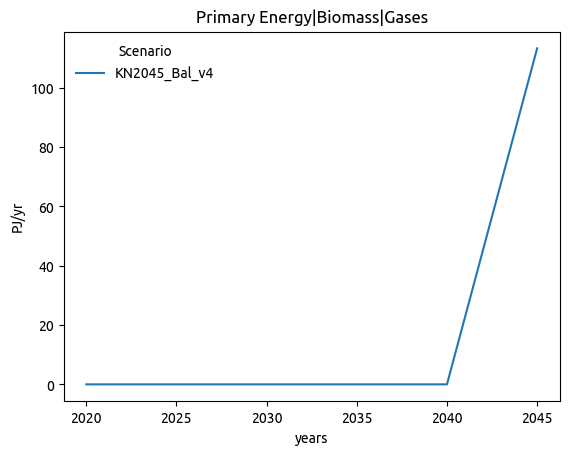
| Primary Energy|Biomass|Gases | 22.54% |
MAPE: Mean Absolute Percentage Error
Threshold: MAPE > 5%
Only variables reaching the threshold are shown. Find the equivalent plot for all of them below.
General Files comparison
| Numeric | Status | NMAE | MAPE | |
|---|---|---|---|---|
| csvs/curtailment.csv | 72.2% | 0.05 | 2.10e+02% | |
| ariadne/exported_variables_full.xlsx | ||||
| ariadne/exported_variables.xlsx | ||||
| csvs/price_statistics.csv | 57.1% | ✅ Almost equal | 0.09 | 0.9% |
| csvs/nodal_cfs.csv | 63.5% | ✅ Almost equal | 0.01 | 65.4% |
| csvs/cfs.csv | 71.8% | ✅ Almost equal | 0.04 | 2.71e+02% |
| csvs/nodal_capacities.csv | 64.2% | ✅ Almost equal | 0.00 | 3.49e+06% |
| csvs/cumulative_cost.csv | 84.7% | ✅ Almost equal | 0.08 | 0.0% |
| csvs/nodal_supply_energy.csv | 59.1% | ✅ Almost equal | 0.00 | 1.85e+07% |
| csvs/capacities.csv | 72.2% | ✅ Almost equal | 0.01 | 5.73e+04% |
| csvs/energy.csv | 72.6% | ✅ Almost equal | 0.02 | 1.26e+05% |
| csvs/costs.csv | 64.7% | ✅ Almost equal | 0.02 | 1.06e+05% |
| csvs/supply.csv | 64.3% | ✅ Almost equal | 0.00 | 2.43e+04% |
| csvs/supply_energy.csv | 64.3% | ✅ Almost equal | 0.02 | 1.35e+05% |
| csvs/metrics.csv | 54.5% | ✅ Almost equal | 0.07 | 0.5% |
| csvs/market_values.csv | 76.7% | ✅ Almost equal | 0.05 | 1.7% |
| csvs/prices.csv | 81.3% | ✅ Almost equal | 0.00 | 0.8% |
| csvs/nodal_costs.csv | 57.8% | ✅ Almost equal | 0.00 | 9.99e+06% |
| csvs/weighted_prices.csv | ✅ Equal |
MAPE: Mean Absolute Percentage Error
NMAE: Mean Absolute Error on Min-Max Normalized Data
Status Threshold: NMAE > 0.05 and MAPE > 5%
Comparing add_subnodes (c081ff4) with main (1eef9c6).
Branch is 15 commits ahead and 0 commits behind.
Last updated on 2024-08-27 12:04:51 CEST.
…ts for add_brownfield
|
Hey @cpschau, looks great! I'm getting a missing file error on these two: Could you add them to |
Unfortunately, they do not have a URL, although they are open and CC-BY-licensed. I will add them to the databundle or create a shared tubcloud-Link to make them available! |
There was a problem hiding this comment.
Choose a reason for hiding this comment
The reason will be displayed to describe this comment to others. Learn more.
@cpschau Looks great! I'd leave a final review until the data is there and I can test the final workflow.
I've left a few comments (which are a little picky since we'll have to extend this in the future with additional features). Mainly, apart from some documentation, I'm wondering if we could modularise add_district_heating_subnodes.py a little.
There was a problem hiding this comment.
Choose a reason for hiding this comment
The reason will be displayed to describe this comment to others. Learn more.
Sorry this took so long! I'm having some problems executing the full pipeline but your additions seem to work:)
Just a few small comments:
- PyPSA docstrings should be in numpy style, as far as I recall
- Could you add a few more comments in
add_subnodes? Some expressions are not that easy to understand.
| """ | ||
| Prepare subnodes by filtering district heating systems data for largest systems and assigning the corresponding LAU and onshore region shapes. | ||
|
|
||
| Parameters: |
There was a problem hiding this comment.
Choose a reason for hiding this comment
The reason will be displayed to describe this comment to others. Learn more.
Could we change the docstring style to numpy? (to be consistent with other PyPSA docstrings)
There was a problem hiding this comment.
Choose a reason for hiding this comment
The reason will be displayed to describe this comment to others. Learn more.
Done





















In this pull request, we introduce subnodes to represent the n largest district heating networks in Germany, as identified from the open Fernwärmeatlas dataset (available upon request at Fernwärmeatlas under CC BY 4.0 license). Largest means the amount of annual district heating feed-in. The number of these largest networks that are modeled explicitly can be determined using the configuration parameter
sector:district_heating:add_subnodes. These district heating subnodes are integrated into existing clusters (referred to as mother nodes), which continue to represent the remaining smaller district heating systems within their respective regions.The annual feed-in data of the district heating systems, as recorded in the dataset, is used to assign the heat loads to the subnodes, with a corresponding reduction in the load of the mother nodes. These loads fall into the categories "urban central heat" and "low-temperature heat for industry". The ratio between those two loads in the mother node is preserved in the subnode.
Existing CHP generation capacities from the MaStR database are allocated to these new subnodes based on their geolocation. For mapping, the LAU regions corresponding to the district heating systems are used. Through a modification in the
add_existing_baseyearfunction within the pypsa-eur subworkflow, a CHP plant is either added to a subnode or remains in a mother node.Additionally, other infrastructure components, such as boilers, heat pumps, resistive heaters, and water tanks, are connected to the subnodes, offering investment options for the system optimization. Heat vents are an option to get rid of excess heat, that is used in the early planning horizons in the subnodes, that have a mismatch between the assigned CHP capacity and the district heating demand, such as Mannheim and Karlsruhe. These systems have to be validated one by one. Direct air capture can also appear on the negative side of the energy balance, as it is modeled as a load of the district heating system.