Correct reporting of CAPEX / OPEX #302
Conversation
for more information, see https://pre-commit.ci
Validator ReportI am the Validator. Download all artifacts here. Ariadne Variables Comparison
NRMSE: Normalized (combined-min-max) Root Mean Square Error Plots
General Plots comparison
Files comparison
NRMSE: Normalized (combined-min-max) Root Mean Square Error Model Metrics Benchmarks
Comparing |


for more information, see https://pre-commit.ci
for more information, see https://pre-commit.ci
|
for more information, see https://pre-commit.ci
for more information, see https://pre-commit.ci
for more information, see https://pre-commit.ci
|
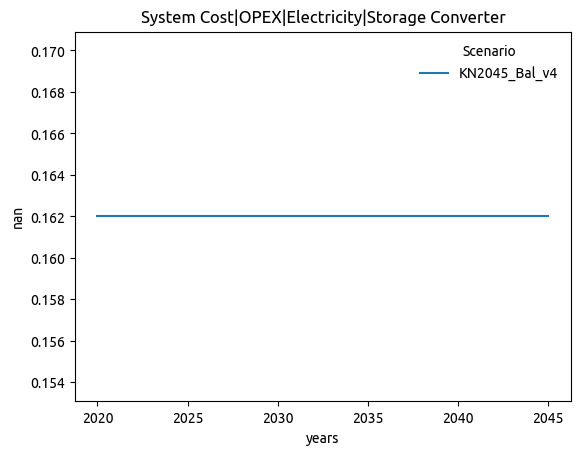
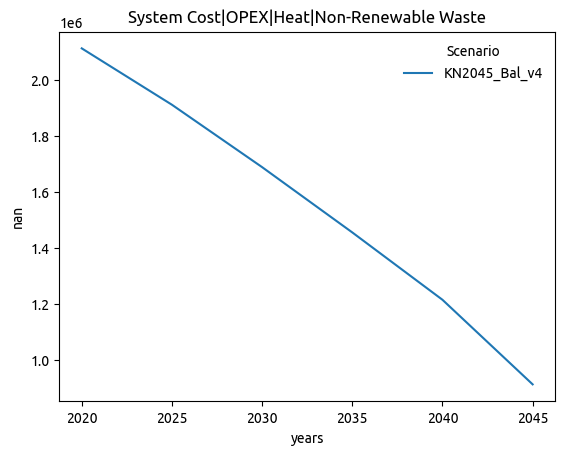
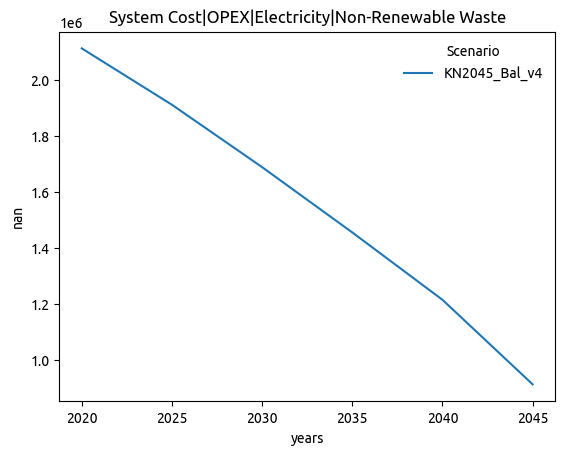
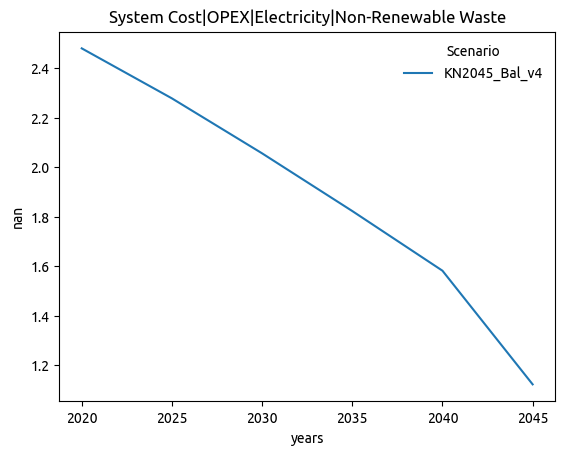
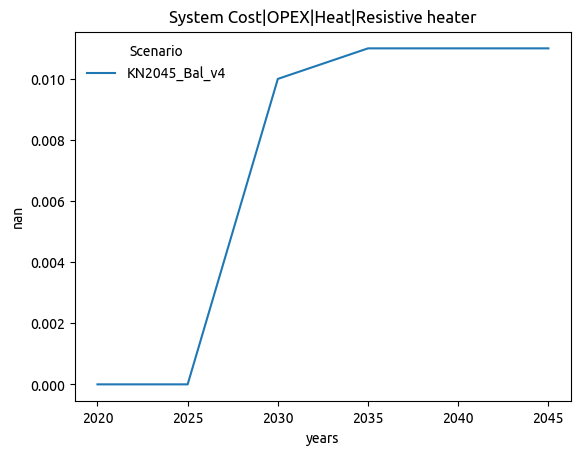
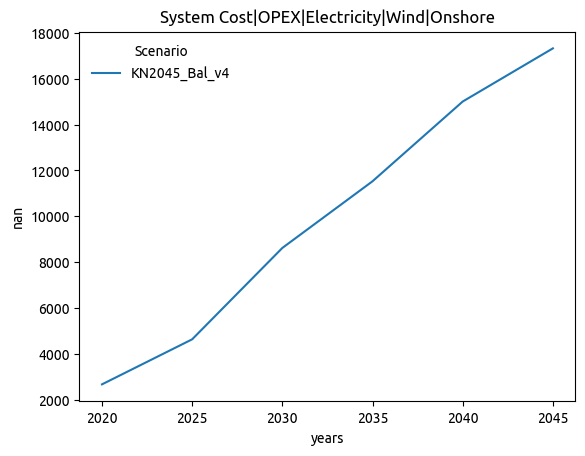
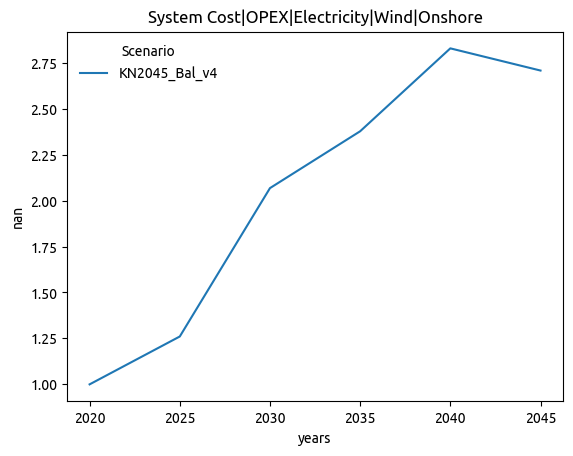
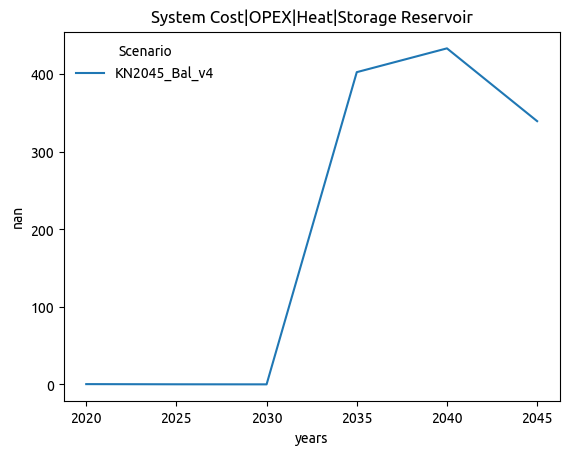
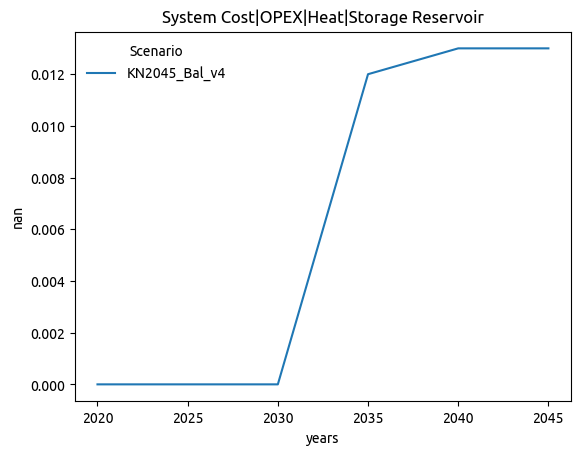
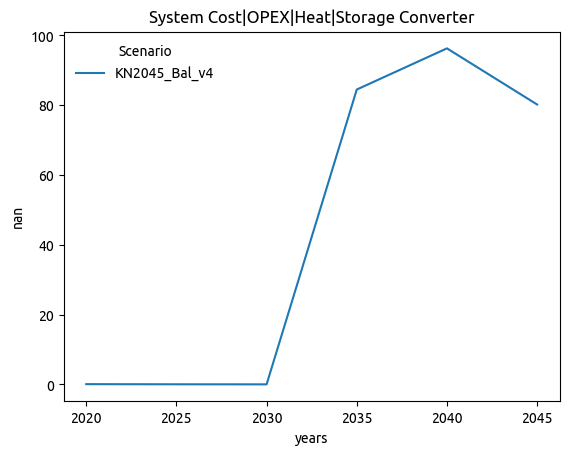
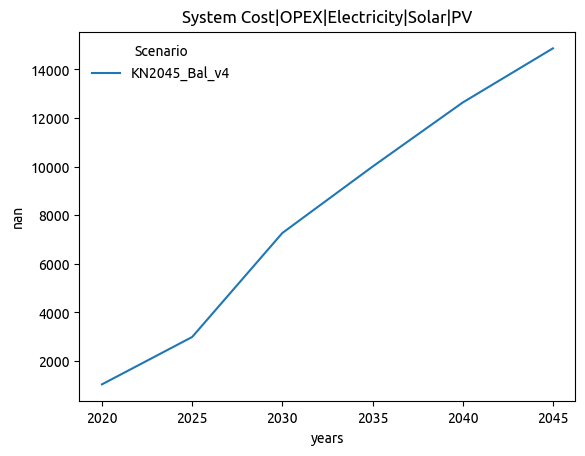
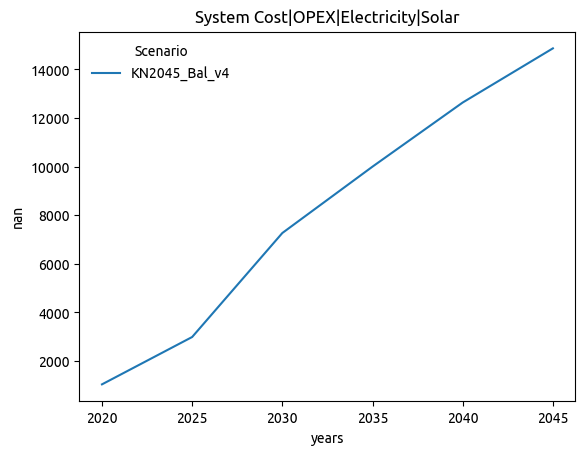
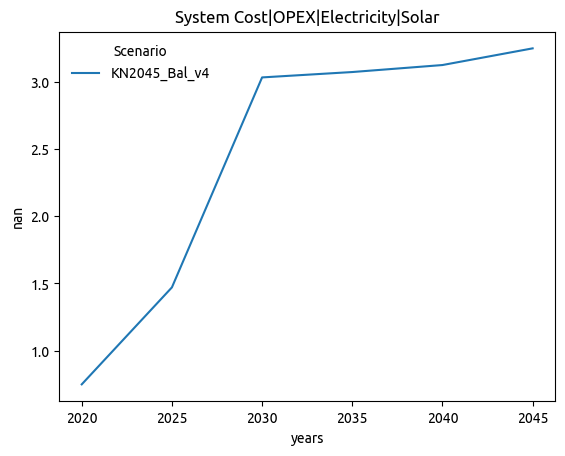
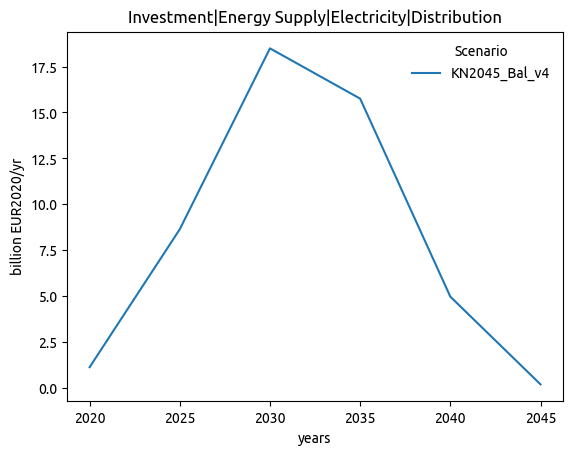
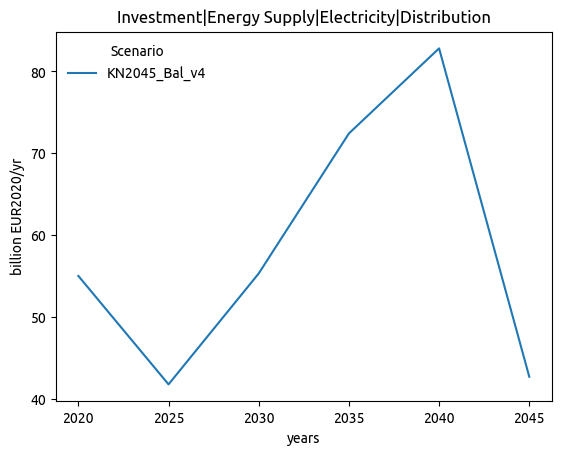
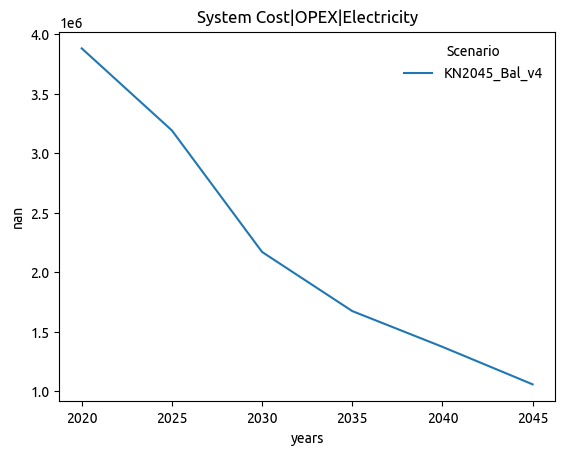
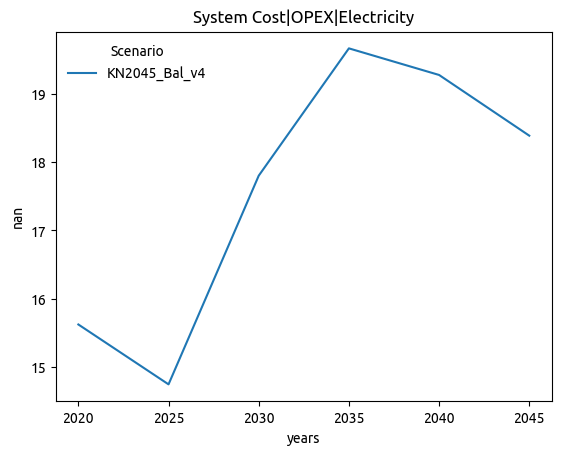
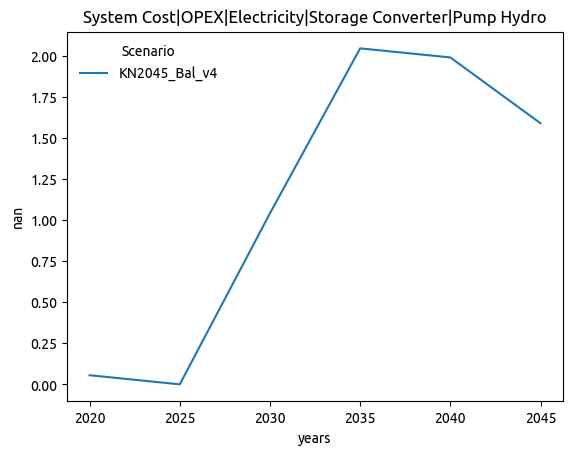
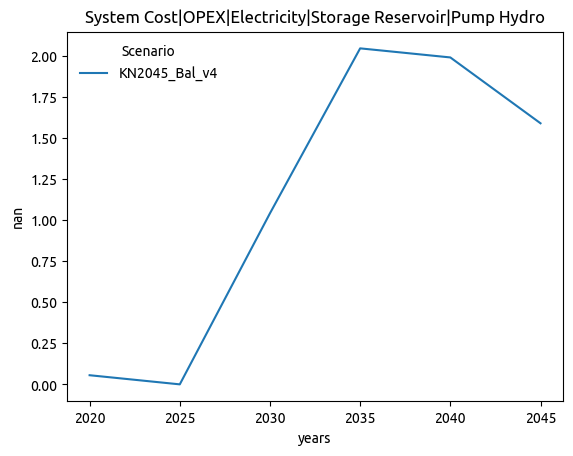
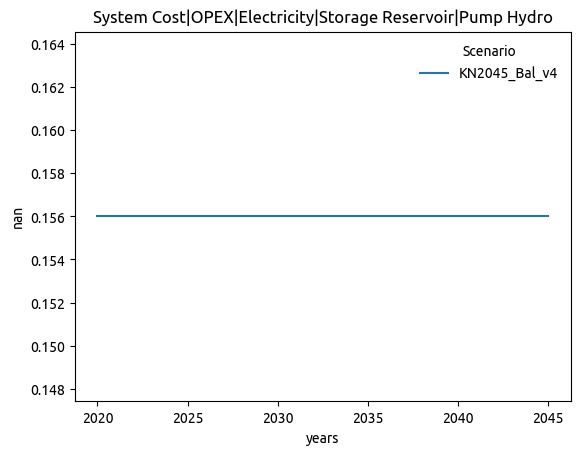
Current state of computing CAPEX: CAPEX:
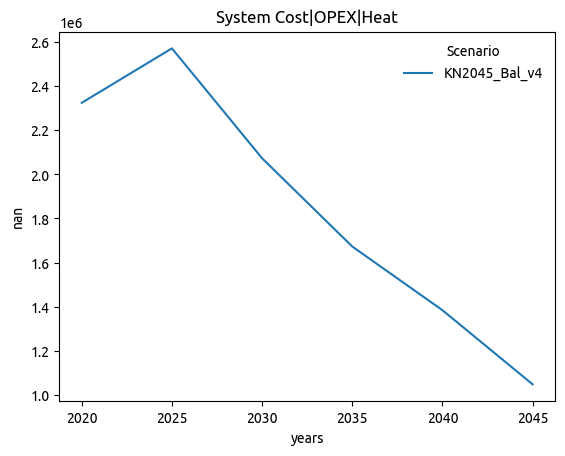
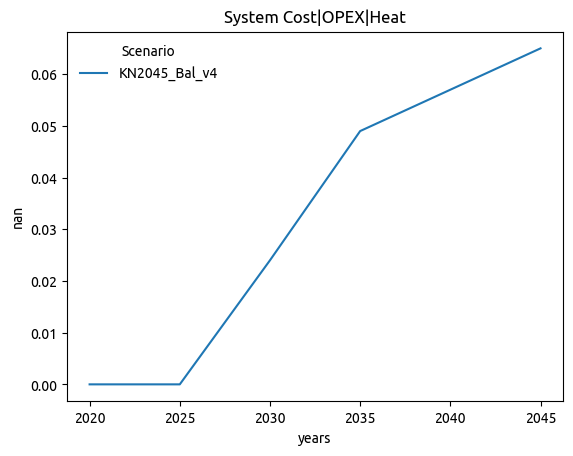
OPEX:
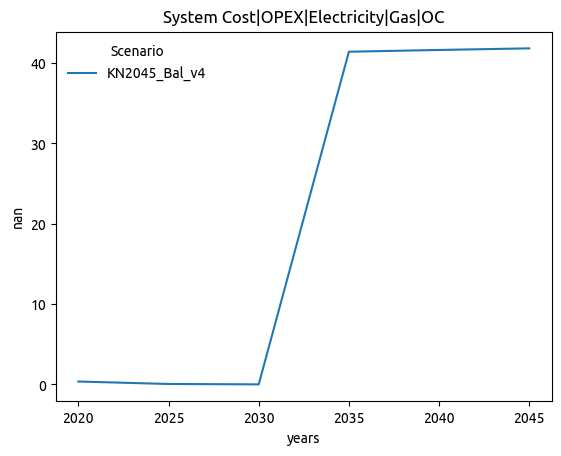
Energy costs:
|
| @@ -5021,6 +5167,18 @@ def process_postnetworks(n, n_start, model_year, snakemake, costs): | |||
| # # The values in p_nom_opt may already be discretized, here we make sure that | |||
| # # the same logic is applied to p_nom and p_nom_min | |||
| # n.links.loc[h2_links, attr] = n.links.loc[h2_links, attr].apply(_h2_lambda) | |||
| logger.info("Assing average Kernnetz cost to carrier H2 pipeline (Kernnetz)") | |||
|
|
||
| return _get_capacities(n, region, _f, cap_string="Capacity Additions|") | ||
| Calculate total investment, CAPEX, and OPEX in the given region. | ||
| """ |
There was a problem hiding this comment.
Add docstring to function
n.statistics.capex and .opex do not actually report CAPEX and OPEX but fixed and marginal costs. Here we compute the Capex and Opex from the overnight_cost, lifetime, discount rate and fixed costs in the post networks. In the mid-term this should all be directly available from the PyPSA Network
Before asking for a review for this PR make sure to complete the following checklist:
ariadne_allcompletes without errorsexport_ariadne_variableshas been adapted to the changesChangelog.mdmainhas been merged into the PRYYYYMMDDdescriptive_title