R 언어 기반, R 4.0.2 버전의 패키지 사용됨.
- [tab/server/plot.R] : 파일변경 -> group column 없을 때 오류 메세지 출력 (2021.10.18 - YH)
- R 4.0.2 버전 다운받기 (최신 버전 다운)
- R 설치 완료 후, R studio 를 다운받아 R 환경 만들기
- R studio Desktop Open Source License 다운받기
-
본 깃허브 상단의
 에서 Download ZIP 을 클릭해 파일을 저장하고 원하는 위치에 압축을 푼다.
 -
IMa3_Making-Histogram 폴더의 runApp.R 스크립트를 R studio에서 실행시킨다.
2-1 runApp.R 을 처음 실행 시킬 때 : 모든 코드 실행
2-2 코드를 기존에 실행시켰을 때 또는 r-miniconda가 설치되어 있을 때
: ### install.packages ### 와, ### Miniconda ### 부분은 실행시키지 않는 것 권장. (### library packages ### 부분은 실행)
특히, Miniconda의 경우 코드는 시간이 오래 걸릴 뿐 만이 아니라 에러 반환 (정상적인 에러, 에러 무시하고 진행하기) -
runApp.R 스크립트에서 setwd() 함수를 통해 working directory를 IMa3_Making-Histogram 폴더 경로로 설정한다.
# example code 1
setwd("C:/Users/rhtn2/OneDrive/Documents//IMa3_Making-Histogram-main")
# example code 2
setwd("C:/Users/Administrator/Desktop/IMa3_Making-Histogram-main")
-
runApp.R 스크립트 전체를 실행시킨다. (대시보드는 새 창으로 연결)
** Brun-Thn 페이지 이용을 원할 시 대시보드 창 상단의  의
의 open in Browser 버튼을 눌러 웹페이지로 열어야 파일 로드를 실행시킬 수 있다. **
코드 실행 시 다음과 같은 새 창이 나온다.
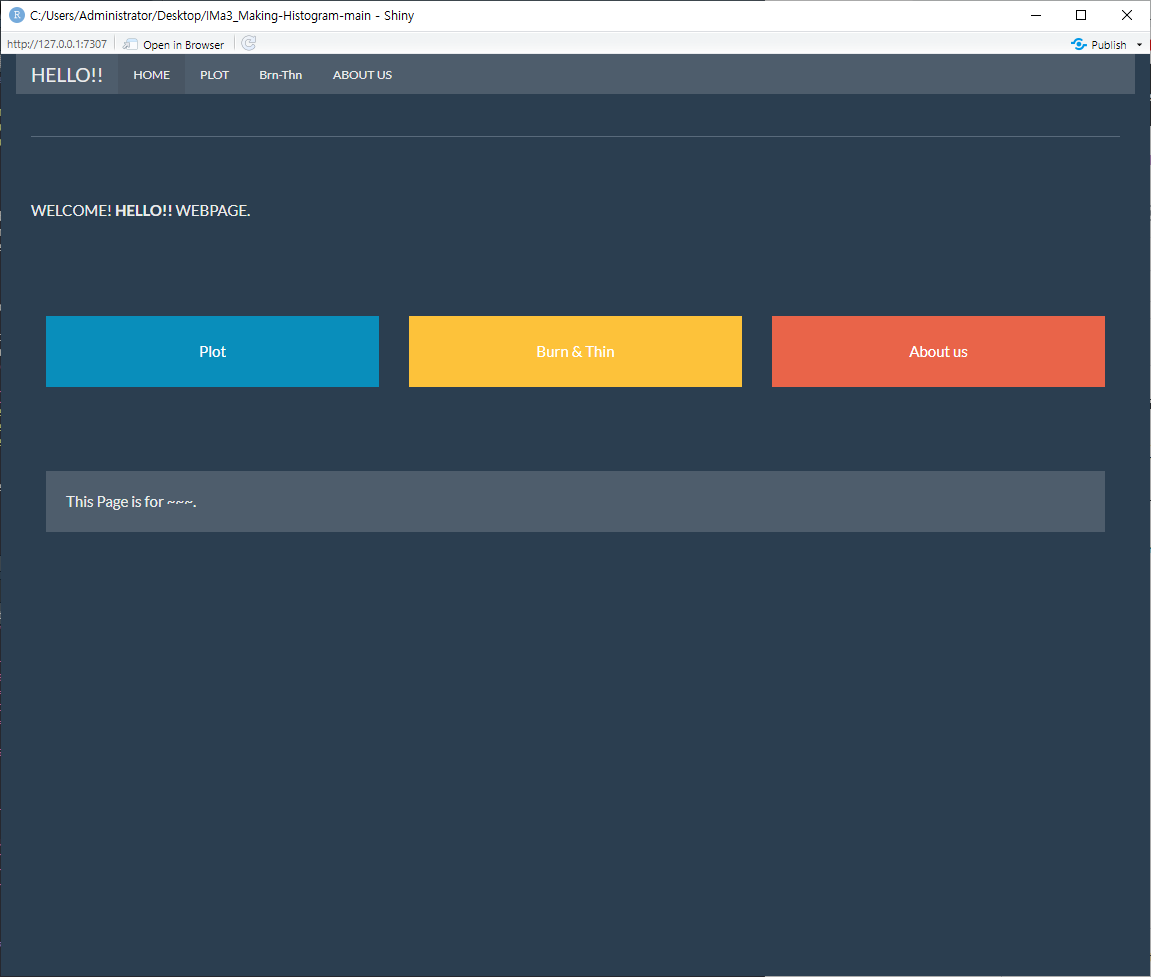 홈페이지 가운데 위치한 파란색, 노랜색, 주황색의 박스를 클릭하면 바로 plot 탭과 Burn&Thin 탭, About us 탭으로 진입할 수 있다.
(상단의 PLOT 탭, Brn-Thin탭, ABOUT US 탭을 클릭해 직접 접근도 가능)
하단에는 이 대시보드에 대한 설명 존재
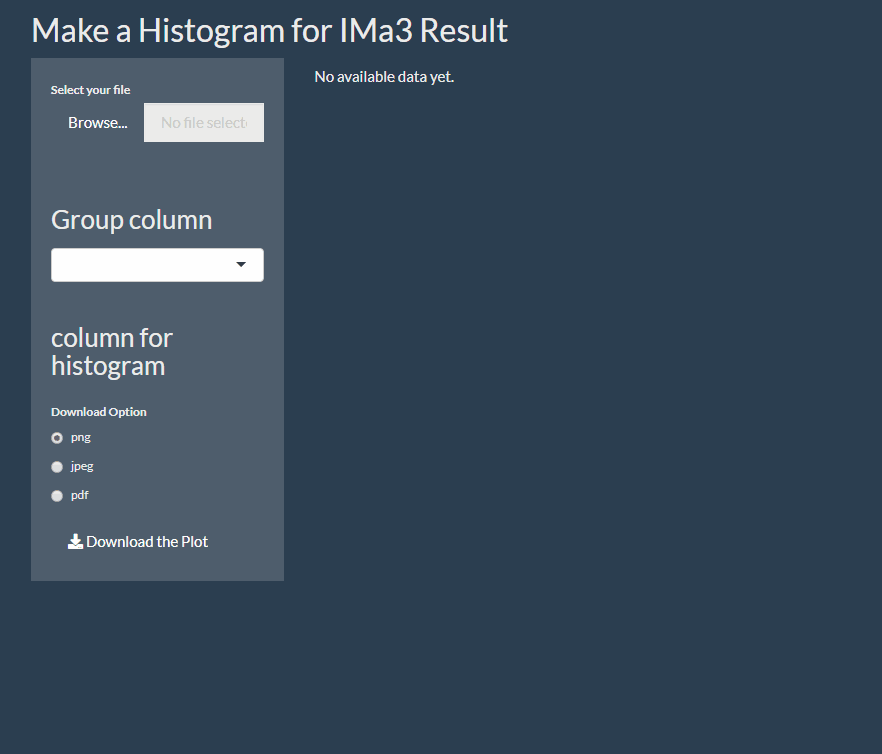
IMa3 결과 파일을 업로드 해 특정 데이터를 히스토그램으로 만드는 탭
작성된 히스토그램 png,jpeg,pdf 형태로 다운 가능
IMa3 결과 파일을 업로드 해 Burn-in 과 Thining 작업 수행
결과물 파일은 업로드 한 파일과 같은 디렉토리에 자동 저장
<예시> Burn-in : 10 , Thining : 40 수행하는 b10t40.ti 파일 생성
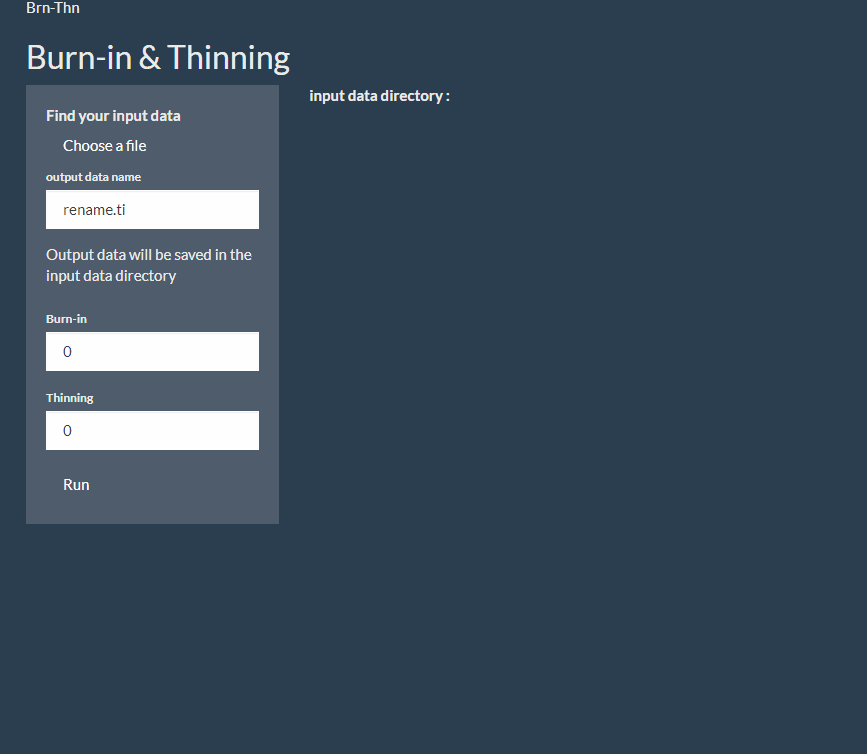
** Brn-Thn 페이지 이용을 원할 시 'Open in Brower'버튼을 눌러 웹페이지로 열어야 파일로드를 실행할 수 있다.
- From the code download button(green button), store the zip file and unzip it to the desired location.
- Run the script 'test_navbar.R' in the 'IMa3_Making-Histogram' folder.
- In the script 'test_navbar.R', set the working directory as the 'IMa3_Making-Histogram' folder path through the setwd('') function.
# example code
setwd("C:/Users/rhtn2/OneDrive/Documents//IMa3_Making-Histogram-main")- Run the entire script 'test_navbar.R'.
** If you want to use the 'Brn-Thn' page, you must press the 'Open in Browser' button to open it as a web page to run the file load.