Chart Extension
JavaFX has 8 kind of Chart component and AsciidocFX supports all of them.
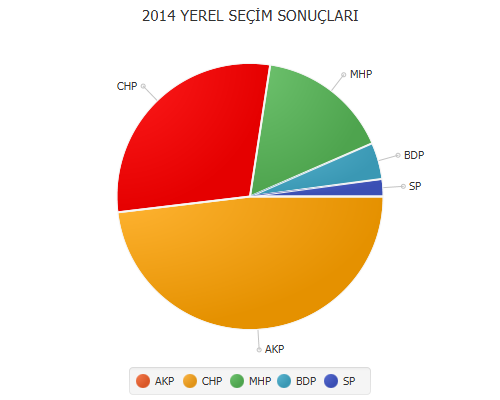
[chart,pie,file="secim-2014-pie.png",opt="title=2014 YEREL SEÇİM SONUÇLARI"]
--
AKP,  45.6, orange
CHP,  27.8,red
MHP,  15.2
BDP,  4.2
SP,  2
--
|
Note
|
All options are optional. To see all available options please look at chart options |
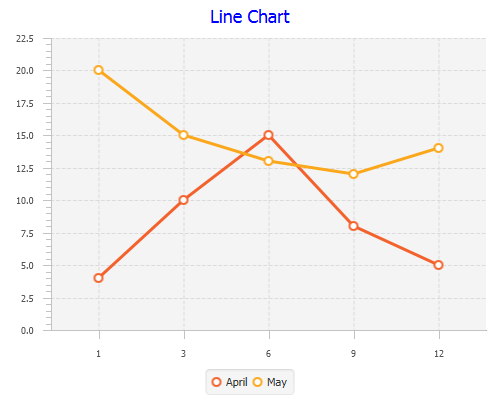
[chart,line,file="secim-2014-line.png",opt="title=Line Chart,title-color=blue"]
--
//April
1,  4
3,  10
6,  15
9,  8
12, 5

//May
1,  20
3,  15
6,  13
9,  12
12, 14
--
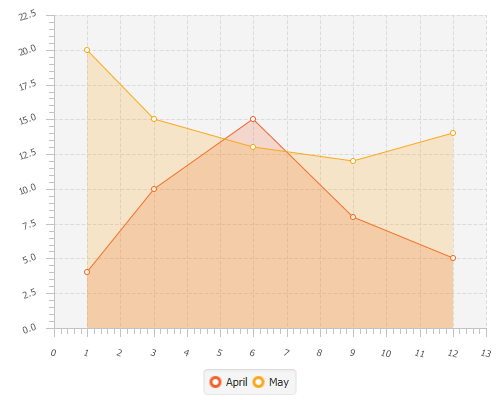
[chart,area,file="area-chart.png",opt="y-label-rotation=-20,x-label-rotation=+20"]
--
//April
1,  4
3,  10
6,  15
9,  8
12, 5

//May
1,  20
3,  15
6,  13
9,  12
12, 14
--
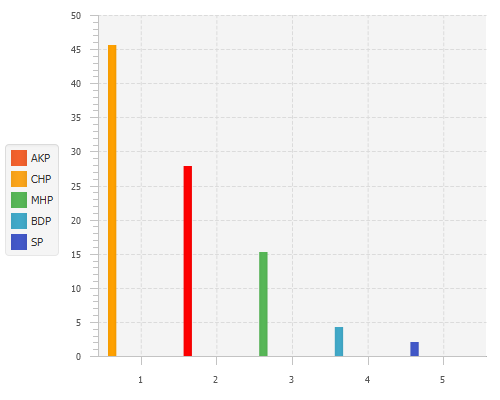
[chart,bar,file="bar-chart.png",opt="legend=left"]
--
//AKP
1,  45.6, orange
//CHP
2,  27.8,red
//MHP
3,  15.2
//BDP
4,  4.2
//SP
5, 2
--
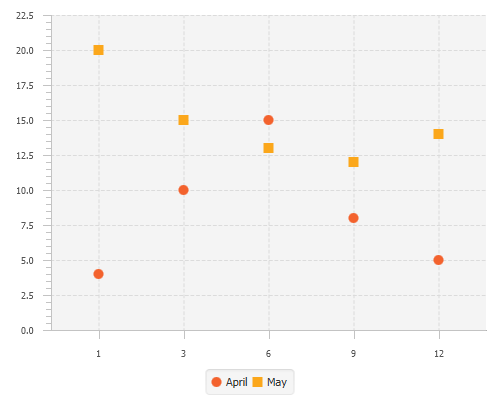
[chart,scatter,file="scatter-chart.png"]
--
//April
1,  4
3,  10
6,  15
9,  8
12, 5

//May
1,  20
3,  15
6,  13
9,  12
12, 14
--
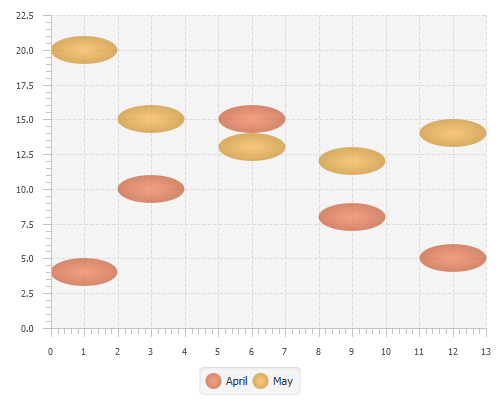
[chart,bubble,file="bubble-chart.png"]
--
//April
1,  4
3,  10
6,  15
9,  8
12, 5

//May
1,  20
3,  15
6,  13
9,  12
12, 14
--
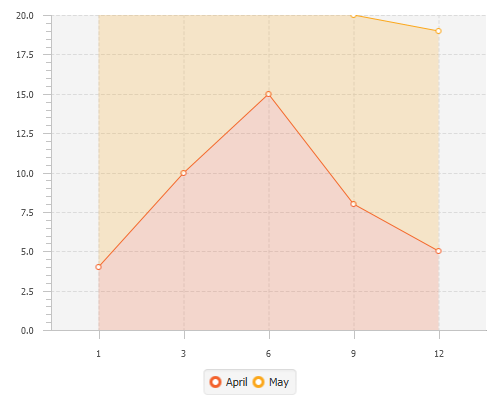
[chart,"stacked-area",file="stacked-area-chart.png"]
--
//April
1,  4
3,  10
6,  15
9,  8
12, 5

//May
1,  20
3,  15
6,  13
9,  12
12, 14
--
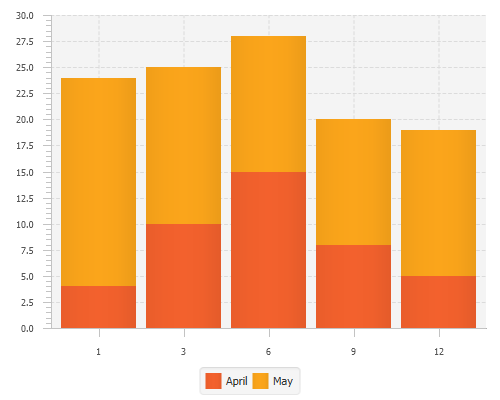
[chart,"stacked-bar",file="stacked-bar-chart.png"]
--
//April
1,  4
3,  10
6,  15
9,  8
12, 5

//May
1,  20
3,  15
6,  13
9,  12
12, 14
--
If you don’t want to use data inside block, we have block macros to reference data in external CSV file.
chart::pie[data-uri=pie.csv]
chart::bar[data-uri=bar.csv]
chart::line[data-uri=line.csv]
chart::area[data-uri=area.csv]
chart::bubble[data-uri=bubble.csv]
chart::scatter[data-uri=scatter.csv]
chart::stacked-area[data-uri=stacked-area.csv]
chart::stacked-bar[data-uri=stacked-bar.csv]