A platform for advanced Machine Learning research and applications.
The goal of rtemis is to make data science efficient and accessible with no compromise on flexibility.
See here for more setup and installation instructions.
install.packages("remotes")
remotes::install_github("egenn/rtemis")
Note: Make sure to keep your installation updated by running remotes::install_github("egenn/rtemis") regularly: it will only proceed if there are updates available
Install dependencies if they are not already installed:
packages <- c("pbapply", "ranger")
.add <- !packages %in% installed.packages()
install.packages(packages[.add])
Load rtemis and get cross-validated random forest performance on the iris dataset:
library(rtemis)
mod <- elevate(iris)
mod$plot()An accumulation of updates and added functionality, algorithms, graphics.
Majority of mplot3 and dplot3 functions now work with the new theme system provided by theme_* functions like theme_lightgrid and theme_darkgrid.
07-02-2019: "Super Papaya" Release out
04-02-2019: rtemis moved to public repo
-
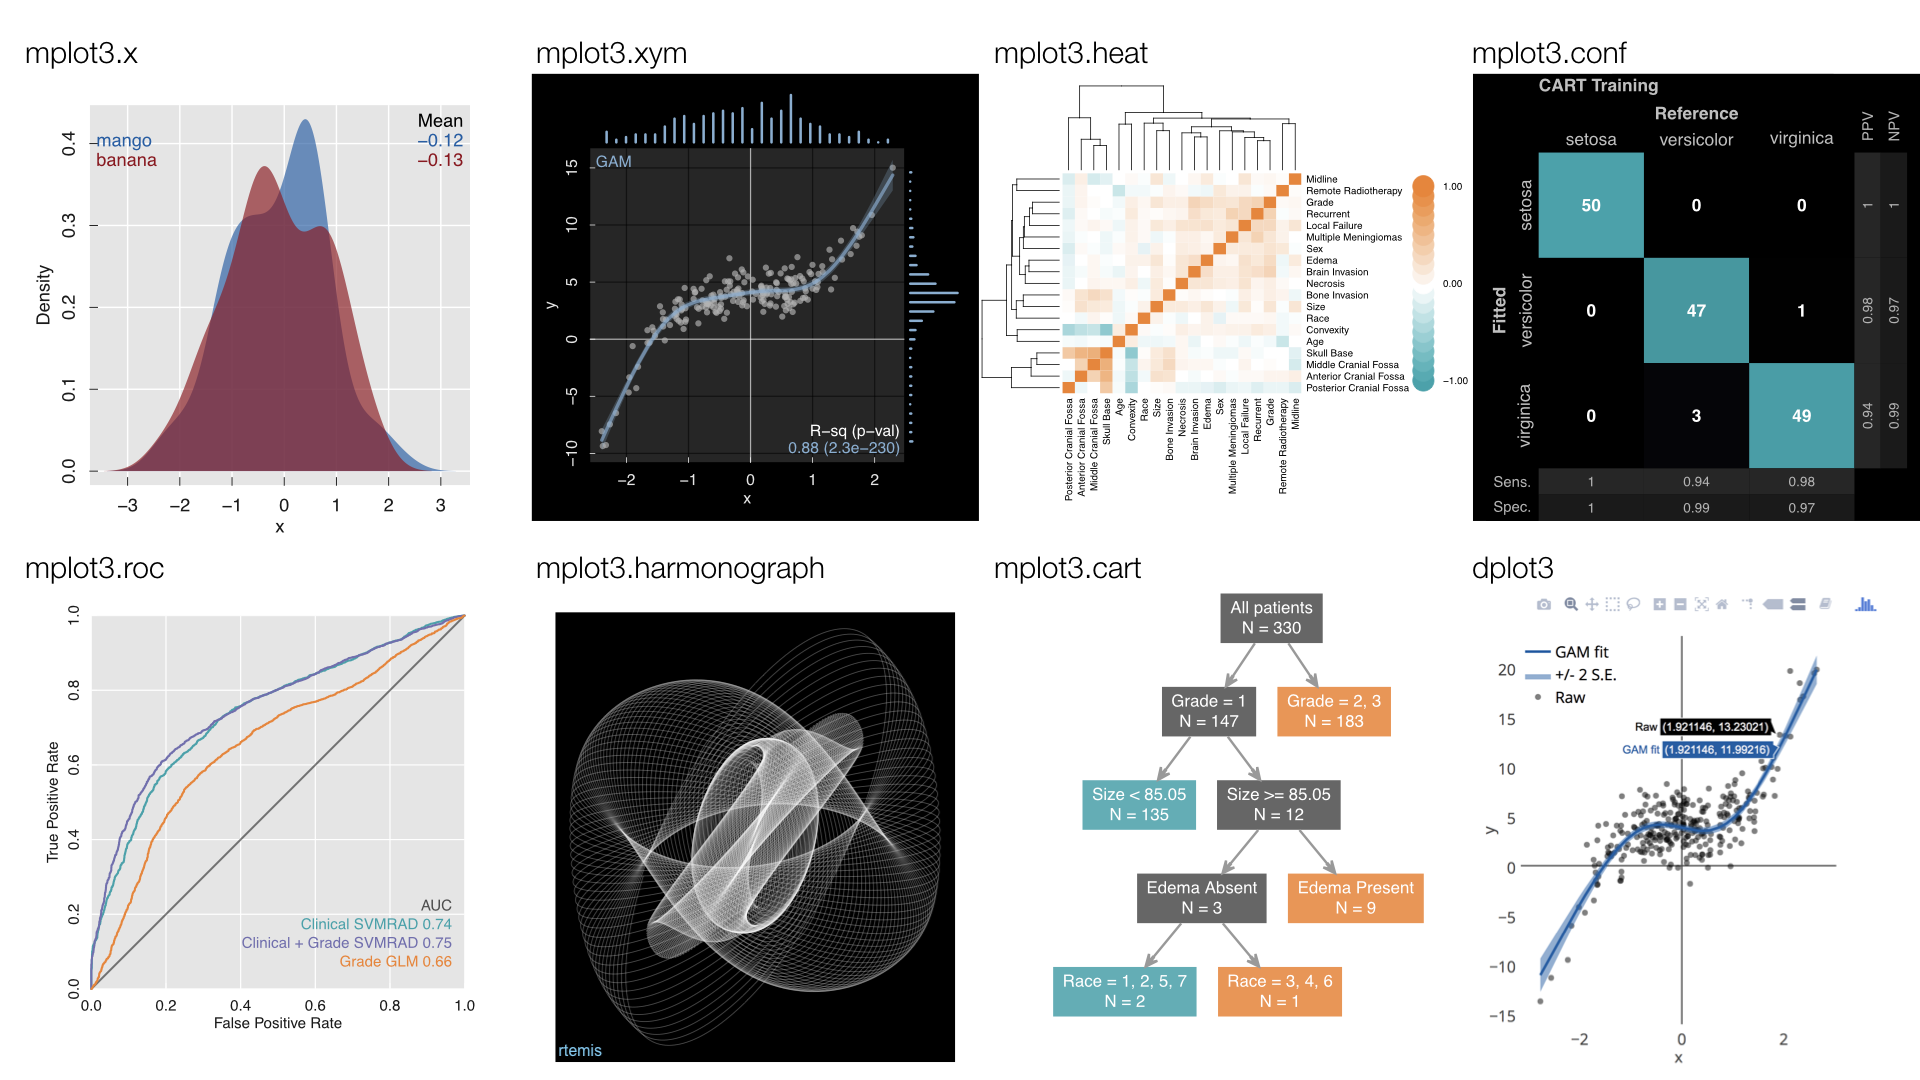
Visualization
- Static: mplot3 family (base graphics)
- Dynamic: dplot3 family (plotly)
-
Unsupervised Learning
- Clustering: u.*
- Decomposition: d.*
-
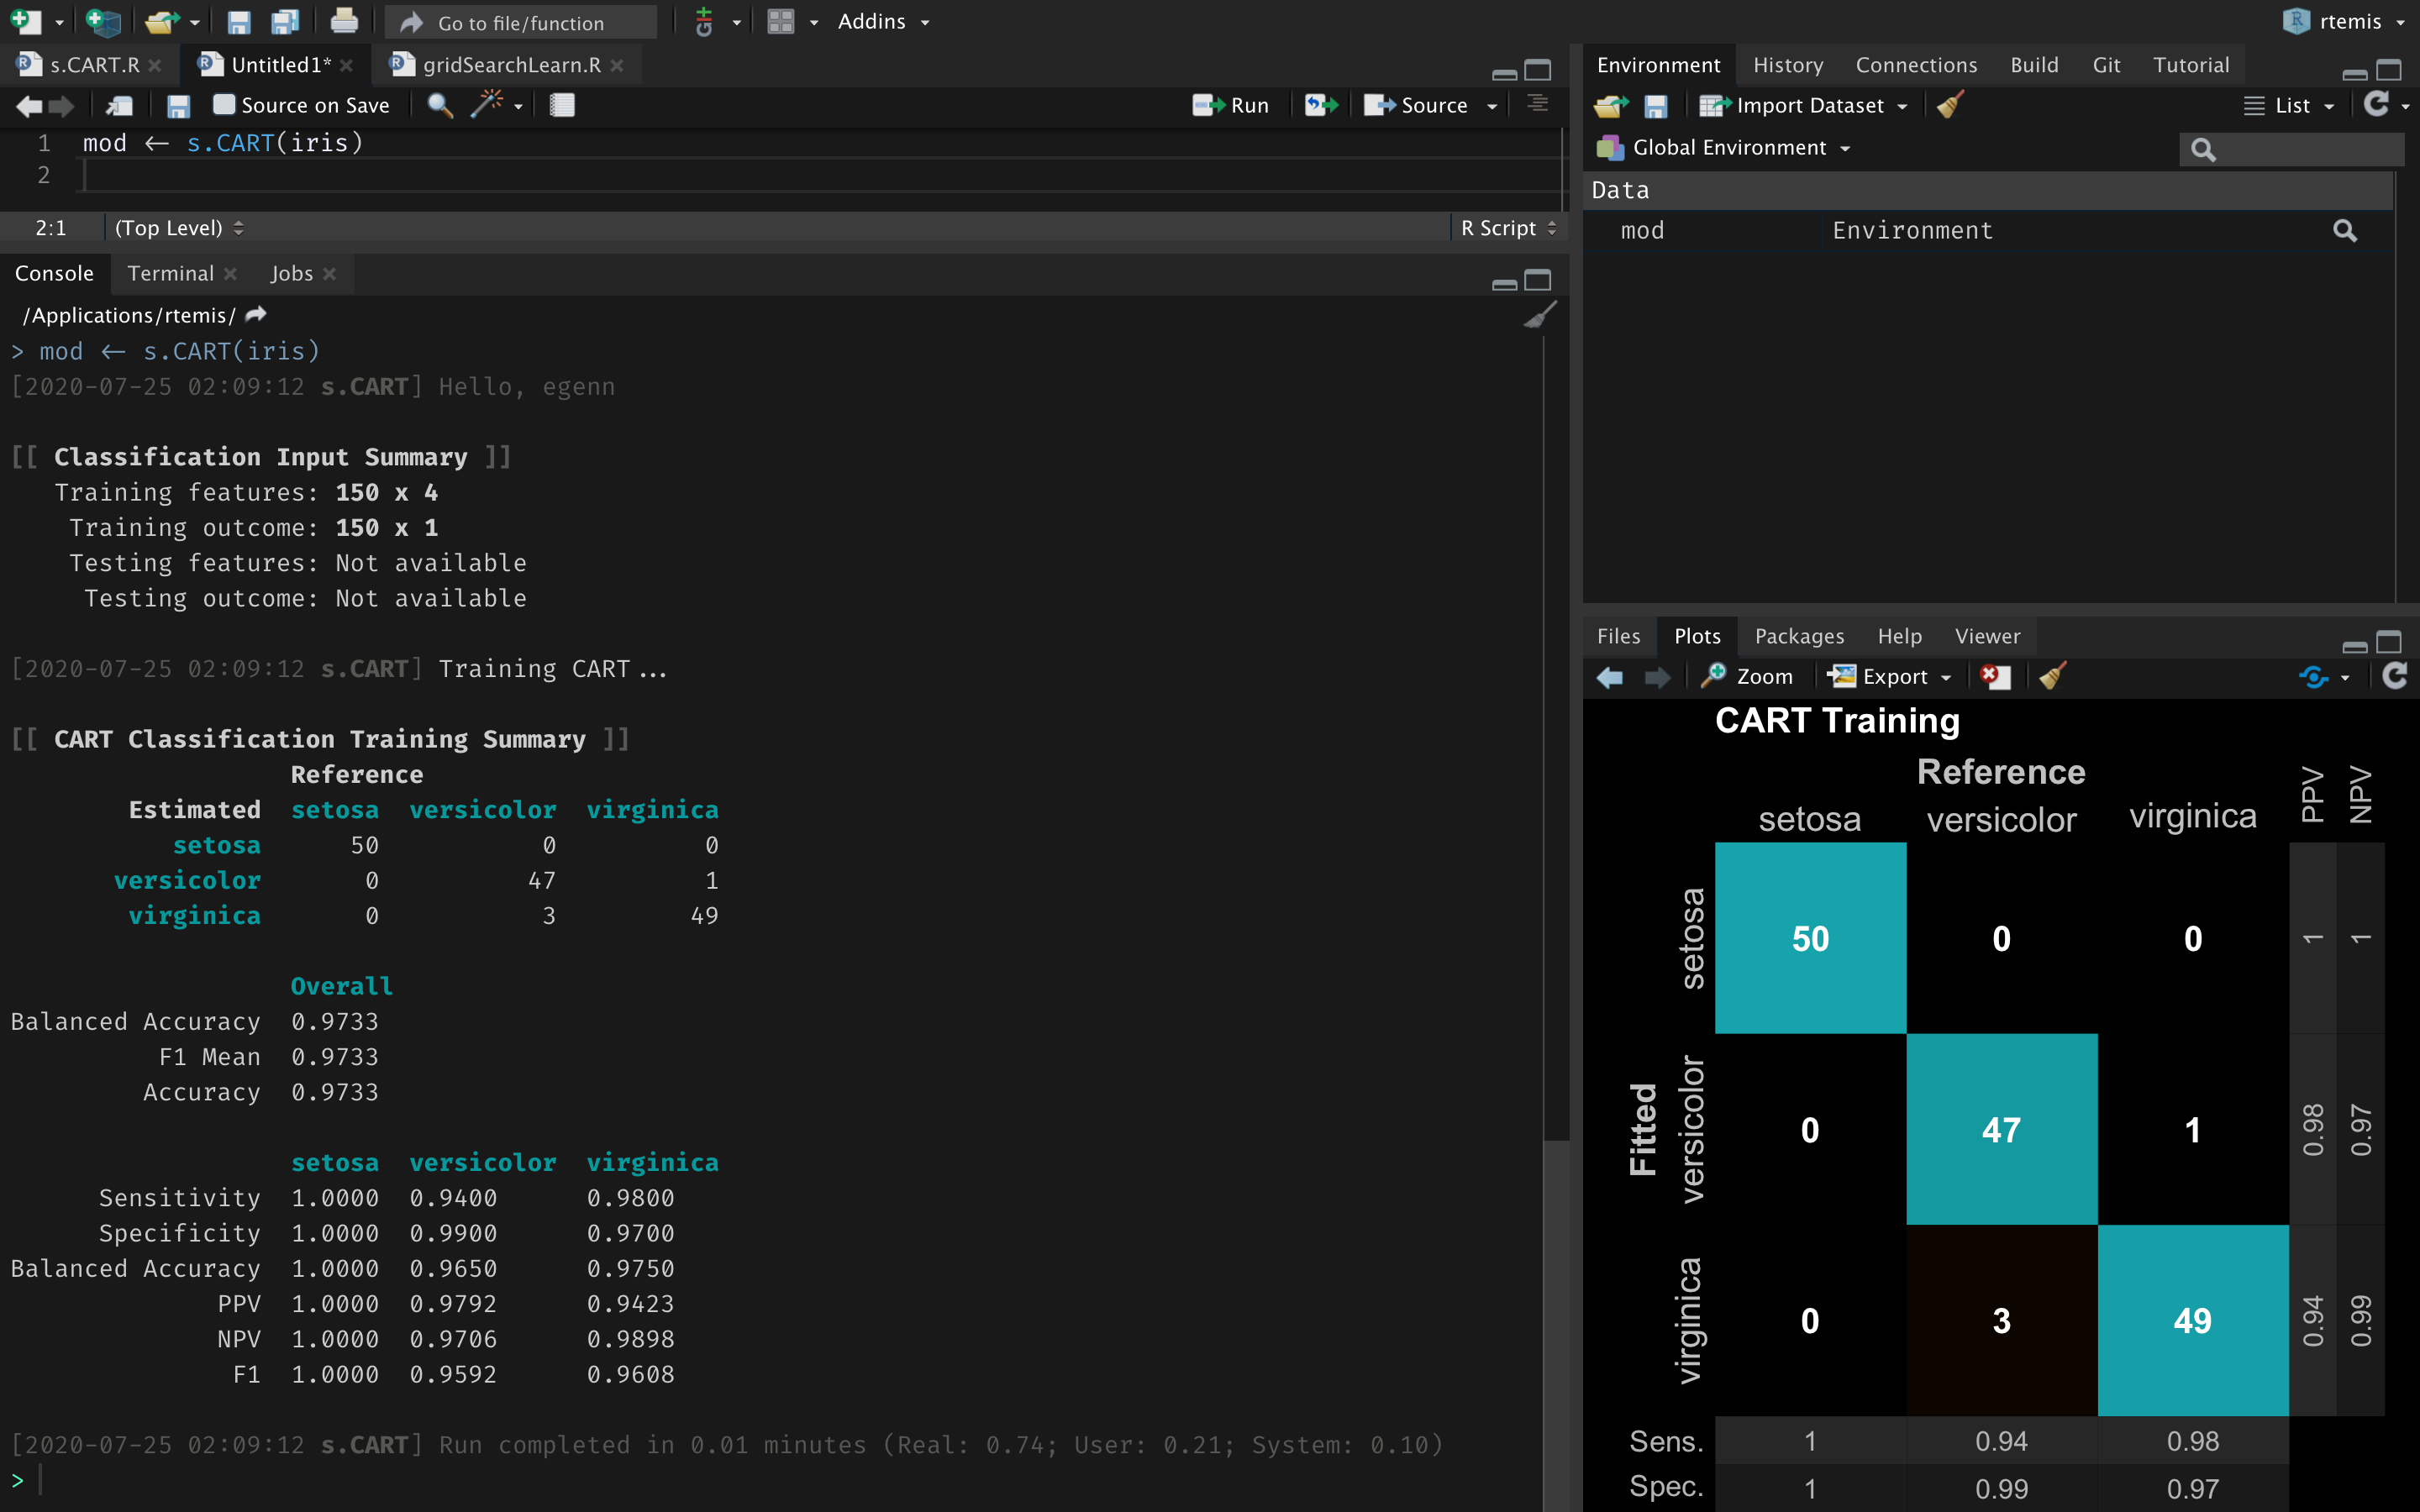
Supervised Learning
- Classification, Regression, Survival Analysis: s.*
-
Cross-Decomposition
- Sparse Canonical Correlation / Sparse Decomposition: x.*
-
Meta-Models
- Model Stacking: metaMod()
- Modality Stacking: metaFeat()
- Group-weighted Stacking: metaGroup()
(metaFeat and metaGroup have been removed for updating)
- rtemis is under active development
- Novel algorithms developed in rtemis will generally be added to this public repository around the publication of the corresponding papers.
- R Documentation is ongoing.