Transform your k3s/Kubernetes cluster monitoring from boring metrics into an engaging, animated 3D experience.
Observatory is a beautiful, real-time 3D visualization dashboard that lets you see your Kubernetes cluster's heartbeat. Watch pods spin up, scale, and disappear in stunning 3D space. No more endless kubectl get pods commands - just open your browser and observe your infrastructure come to life.
- 📊 Resource Metrics - Pods visually scale with memory usage and glow based on CPU load
- 🛰️ Sidecar Visualization - Multi-container pods show sidecars as orbiting satellites
- 🔥 Heat Effects - Watch CPU usage in real-time with color-coded glow (blue to red)
- 📈 Live Updates - Metrics stream every 5 seconds for instant visual feedback
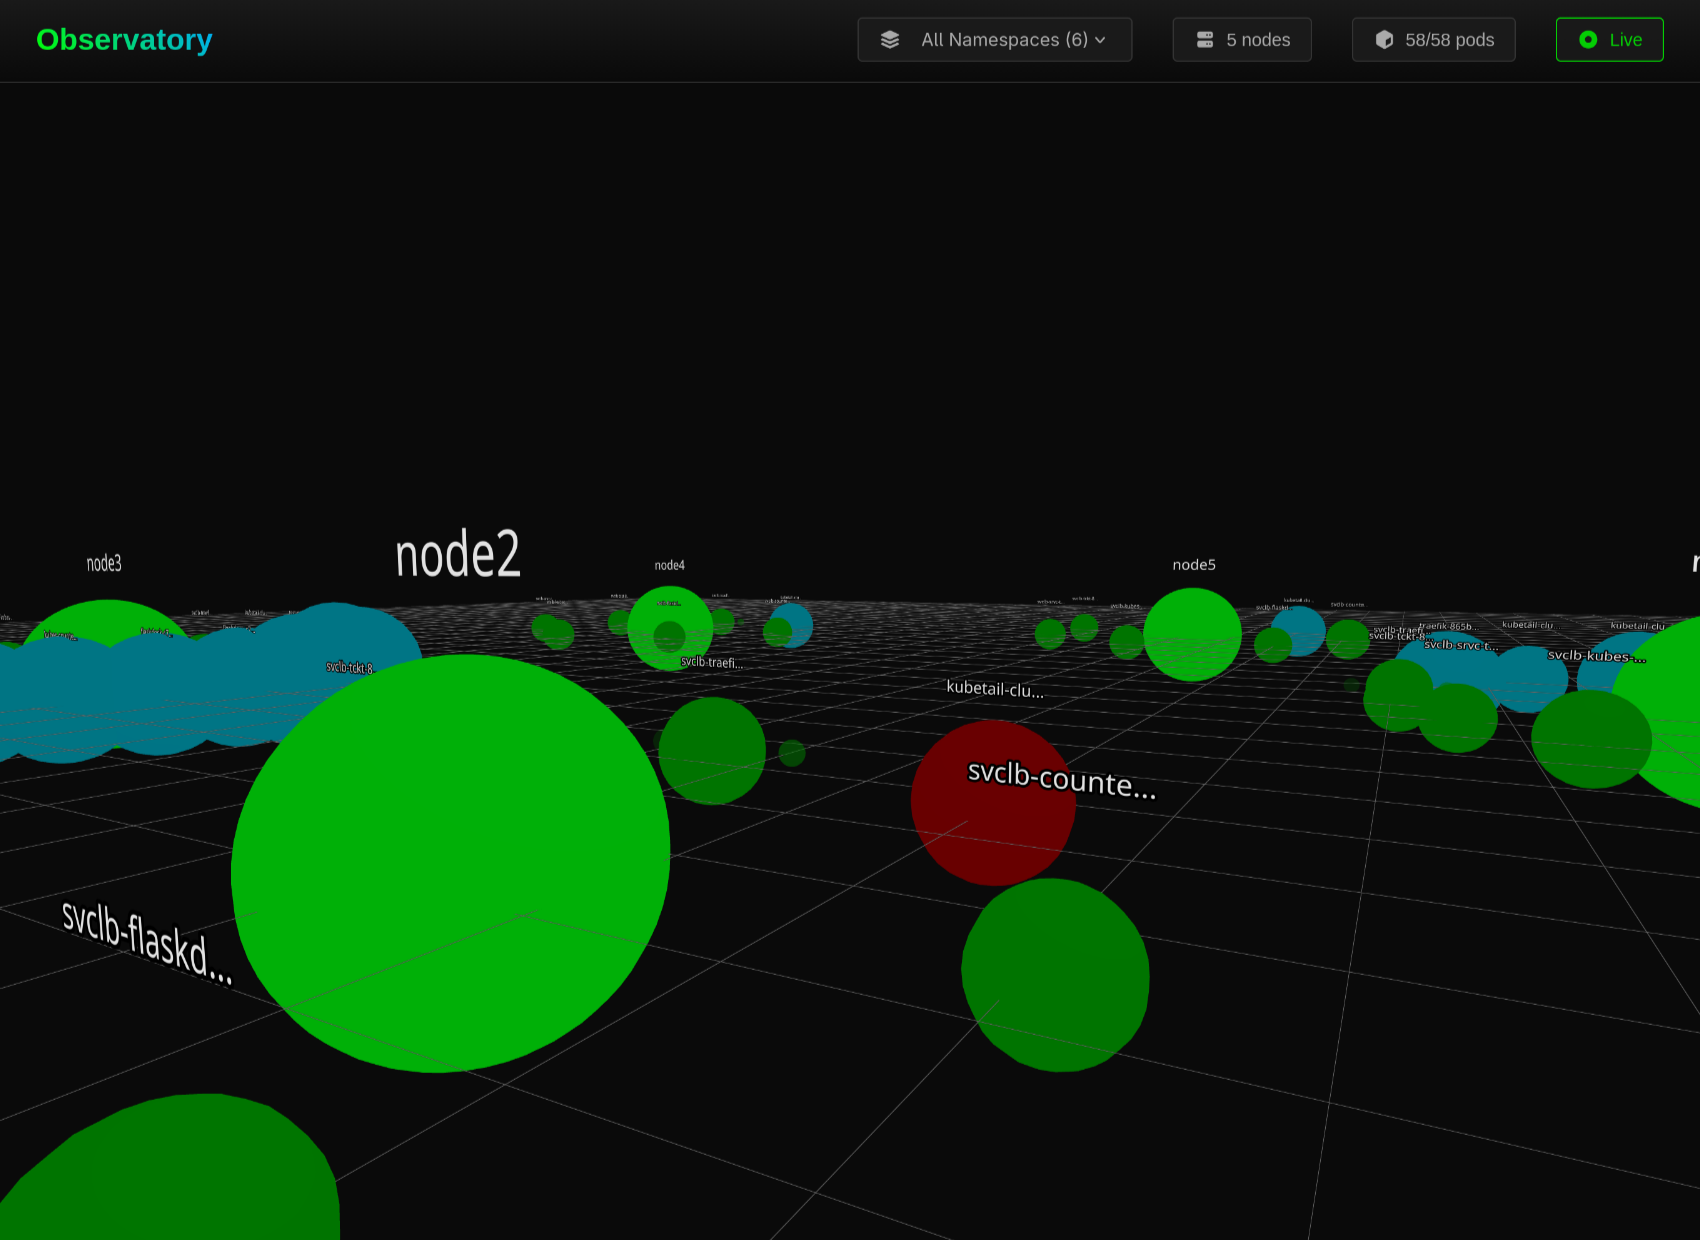



- 🌌 Immersive 3D Visualization - Nodes as spheres, pods orbiting in space with Three.js/React Three Fiber
- ⚡ Real-Time Updates - WebSocket-powered live updates with zero page refreshes
- 🎨 Color-Coded Status - Instant visual feedback (🟢 Running, 🔵 Pending, 🔴 Failed,
⚠️ Warning) - 🖱️ Interactive Controls - Orbit, zoom, and pan through your cluster
- 🎯 Zero Config - Works out of the box with your existing kubeconfig
- 📊 Memory-Based Sizing - Pod spheres scale based on actual memory usage (logarithmic scaling)
- 🔥 CPU Heat Glow - Visual CPU usage gradient: Blue (low) → Cyan → Yellow → Orange → Red (high)
- 🛰️ Sidecar Satellites - Multi-container pods show sidecars (istio-proxy, envoy, etc.) as orbiting moons
- 📈 Real-Time Metrics - Live CPU/memory updates every 5 seconds via metrics-server integration
- 🎭 Smart Container Detection - Automatic identification of main containers vs sidecars
- 📢 Smart Toast Notifications - Non-intrusive alerts for pod/node lifecycle events
- 🏷️ Namespace Filtering - Focus on what matters with dropdown namespace selection
- 🔄 Dynamic Redistribution - Pods smoothly reposition when scaled up/down
- 💚 Connection Health - Live/Offline indicator with automatic reconnection
Coming soon! Add screenshots/GIFs of your Observatory in action
- Go 1.21+ - Backend runtime
- Node.js 18+ - Frontend tooling
- k3s/Kubernetes cluster - The cluster you want to visualize
- kubectl configured - With access to your cluster
- metrics-server (optional but recommended) - For resource visualization features
Note: Resource visualization features (CPU/memory sizing and glow) require metrics-server. If not installed, Observatory will still work but won't show resource metrics.
1. Clone the repository
git clone https://github.com/craigderington/k3s-observatory.git
cd k3s-observatory
2. Set up the backend
cd backend
go mod download

# Point to your kubeconfig
export KUBECONFIG=/path/to/your/k3s.yaml

# Run the backend
go run cmd/observatory/main.go
The backend will start on http://localhost:8000 and begin watching your cluster.
3. Set up the frontend (in a new terminal)
cd frontend
npm install
npm run dev
The frontend will start on http://localhost:3000.
4. Open your browser
Navigate to http://localhost:3000 and watch your cluster come to life! 🎉
- 🖱️ Navigate: Left-click and drag to orbit the camera
- 🔍 Zoom: Scroll wheel to zoom in/out
- 🏷️ Filter: Use the namespace dropdown to focus on specific namespaces
- 👆 Inspect: Hover over pods/nodes to see their names
- 📊 Monitor: Watch the Live status indicator and pod/node counts in the header
Pod Colors (Health Status):
- 🟢 Green - Running and healthy
- 🔵 Blue - Pending (waiting to be scheduled)
- 🔴 Red - Failed or error state
- ⚫ Gray - Succeeded/completed
- 🟡 Yellow - Warning state
Pod Glow (CPU Usage):
- 💙 Blue glow - Low CPU usage (0-25%)
- 💛 Yellow/Cyan glow - Medium CPU usage (25-50%)
- 🧡 Orange glow - High CPU usage (50-75%)
- ❤️ Red glow - Very high CPU usage (75-100%+)
Pod Size (Memory Usage):
- Small spheres = Low memory usage
- Large spheres = High memory usage
- Size scales logarithmically from 0-1024MB
Sidecar Satellites:
- Small orbiting spheres around the main pod
- Automatically detected (istio-proxy, envoy, fluentd, etc.)
- Each sidecar shows its own CPU glow and status color
Deploy something to your cluster and watch it appear:
# Scale a deployment
kubectl scale deployment my-app --replicas=5

# Delete a pod
kubectl delete pod my-pod-abc123

# Deploy a new app
kubectl apply -f deployment.yaml
You'll see pods appear, transition through states (Pending → Running), and redistribute smoothly around their nodes!
Try the included test deployment:
kubectl apply -f k8s/test-deployment.yamlThis creates 3 nginx pods in the observatory-test namespace. Watch them appear in real-time!
The easiest way to run Observatory is with Docker Compose:
1. Set your kubeconfig location
export KUBECONFIG=/path/to/your/k3s.yaml2. Start Observatory
docker-compose up -d3. Access the UI
Open http://localhost:3000 in your browser!
4. View logs
# Both services
docker-compose logs -f

# Just backend
docker-compose logs -f backend

# Just frontend
docker-compose logs -f frontend
5. Stop Observatory
docker-compose downBackend:
cd backend
docker build -t observatory-backend .
docker run -d \
  -p 8000:8000 \
  -v $KUBECONFIG:/root/.kube/config:ro \
  --name observatory-backend \
  observatory-backend
Frontend:
cd frontend
docker build -t observatory-frontend .
docker run -d \
  -p 3000:80 \
  --name observatory-frontend \
observatory-frontend- ✅ Multi-stage builds - Small, optimized images
- ✅ Health checks - Docker monitors service health
- ✅ Auto-restart - Containers restart on failure
- ✅ Nginx proxy - Frontend proxies API/WebSocket to backend
- ✅ Volume mounts - Kubeconfig mounted read-only
Backend:
PORT- Backend port (default: 8000)KUBECONFIG- Path to kubeconfig (mounted as volume)
Frontend:
- No environment variables needed (configured via Nginx)
┌─────────────────────────────────────────────────┐
│  Browser (React + Three.js)                     │
│  ├─ 3D Scene Renderer (React Three Fiber)       │
│  │  ├─ Memory-based pod sizing                  │
│  │  ├─ CPU heat glow effects                    │
│  │  └─ Sidecar satellite rendering               │
│  ├─ WebSocket Client (Auto-reconnect)           │
│  └─ Control Panel UI (React + CSS)              │
└─────────────────┬───────────────────────────────┘
                  │ WebSocket + REST
┌─────────────────▼───────────────────────────────┐
│  Observatory Backend (Go)                       │
│  ├─ WebSocket Hub (gorilla/websocket)           │
│  ├─ Kubernetes Watchers (client-go)             │
│  ├─ Metrics Fetcher (5s interval)               │
│  ├─ REST API Endpoints                          │
│  └─ Event Broadcaster                           │
└─────────────────┬───────────────────────────────┘
                  │ Kubernetes API + Metrics API
┌─────────────────▼───────────────────────────────┐
│  k3s/Kubernetes Cluster                         │
│  ├─ Nodes (compute resources)                   │
│  ├─ Pods (running workloads)                    │
│  ├─ Watch API (real-time events)                │
│  └─ Metrics Server (CPU/memory metrics)         │
└─────────────────────────────────────────────────┘
- Backend connects to your k3s/Kubernetes cluster using your kubeconfig
- Watchers monitor nodes and pods for any changes (add/modify/delete)
- Metrics fetcher polls CPU/memory data from metrics-server every 5 seconds
- WebSocket broadcasts events and metrics updates to all connected frontend clients in real-time
- Frontend receives updates and renders:
- Pod size based on memory usage
- Pod glow color/intensity based on CPU usage
- Sidecar containers as orbiting satellites
- Dynamic positioning recalculates pod orbits around nodes when the cluster changes
Backend:
- Go 1.21+
- gorilla/websocket - WebSocket server
- client-go - Kubernetes API client
Frontend:
- React 18
- Three.js - 3D rendering engine
- React Three Fiber - React renderer for Three.js
- @react-three/drei - Useful helpers for R3F
- Vite - Build tool and dev server
- TypeScript - Type safety
Health check endpoint.
Response:
{
  "status": "ok"
}Fetch all nodes in the cluster with their 3D positions.
Response:
[
  {
    "id": "node-uid-123",
    "name": "node1",
    "status": "Ready",
    "cpu": {
      "used": 0,
      "total": 4.0
    },
    "memory": {
      "used": 0,
      "total": 8.0
    },
    "pods": [],
    "labels": {
      "kubernetes.io/hostname": "node1"
    },
    "position": {
      "x": 10.0,
      "y": 0.0,
      "z": 0.0
    }
  }
]Fetch all pods across all namespaces with their 3D positions.
Response:
[
  {
    "id": "pod-uid-456",
    "name": "nginx-deployment-abc123",
    "namespace": "default",
    "status": "Running",
    "nodeName": "node1",
    "containers": [
      {
        "name": "nginx",
        "status": "Running",
        "restarts": 0,
        "type": "main",
        "cpu": 250.5,
        "memory": 128.3
      },
      {
        "name": "istio-proxy",
        "status": "Running",
        "restarts": 0,
        "type": "sidecar",
        "cpu": 50.2,
        "memory": 64.1
      }
    ],
    "createdAt": "2025-01-15T10:30:00Z",
    "position": {
      "x": 12.5,
      "y": 0.0,
      "z": 1.2
    },
    "cpu": 300.7,
    "memory": 192.4
  }
]
Container Types:
main- Primary application container (usually the first container)sidecar- Supporting container (detected by name: istio-proxy, envoy, fluentd, etc.)init- Init container (runs before main containers)
Connect to ws://localhost:8000/ws to receive real-time cluster events.
Heartbeat (Ping):
{
  "type": "ping"
}
Send every 30 seconds to keep the connection alive. The backend has a 60-second read timeout.
All events follow this structure:
{
  "type": "event_type",
  "data": {
    "pod": { /* Pod object */ },
    "node": { /* Node object */ }
  }
}
Event Types:
pod_added- New pod createdpod_modified- Pod status/spec changed (e.g., Pending → Running)pod_deleted- Pod removednode_added- Node joined clusternode_modified- Node status changed (e.g., resource usage, conditions)node_deleted- Node removed from clustermetrics_update- CPU/memory metrics update (broadcast every 5 seconds)
Example: Pod Added
{
  "type": "pod_added",
  "data": {
    "pod": {
      "id": "pod-uid-789",
      "name": "my-app-xyz",
      "namespace": "production",
      "status": "Pending",
      "nodeName": "",
      "position": { "x": 0, "y": 0, "z": 0 }
    }
  }
}
Example: Metrics Update
{
  "type": "metrics_update",
  "data": {
    "type": "metrics_update",
    "pods": [
      {
        "podId": "pod-uid-456",
        "name": "nginx-deployment-abc123",
        "namespace": "default",
        "totalCpu": 300.7,
        "totalMemory": 192.4,
        "containers": [
          {
            "name": "nginx",
            "cpu": 250.5,
            "memory": 128.3
          },
          {
            "name": "istio-proxy",
            "cpu": 50.2,
            "memory": 64.1
          }
        ],
        "timestamp": "2025-01-15T10:35:22Z"
      }
    ],
    "timestamp": "2025-01-15T10:35:22Z"
  }
}
Note: Metrics updates are only sent if metrics-server is installed and accessible. CPU values are in millicores (1000m = 1 core), memory values are in MB.
k3s-observatory/
├── backend/
│   ├── cmd/observatory/      # Main entry point
│   │   └── main.go
│   ├── internal/
│   │   ├── k8s/             # Kubernetes client, watchers, data models
│   │   │   ├── client.go
│   │   │   ├── nodes.go
│   │   │   ├── pods.go
│   │   │   ├── watcher.go
│   │   │   ├── operations.go        # Describe, logs, metrics
│   │   │   ├── metrics_fetcher.go   # Metrics polling service
│   │   │   └── types.go             # Data models
│   │   ├── api/             # REST API handlers
│   │   │   └── handler.go
│   │   └── websocket/       # WebSocket hub and client management
│   │       ├── hub.go
│   │       ├── client.go
│   │       └── handler.go
│   ├── go.mod
│   └── go.sum
├── frontend/
│   ├── src/
│   │   ├── components/      # React components
│   │   │   ├── Scene.tsx            # Main 3D scene
│   │   │   ├── NodeSphere.tsx       # Node visualization
│   │   │   ├── PodSphere.tsx        # Pod visualization with metrics
│   │   │   ├── SidecarSphere.tsx    # Sidecar satellite rendering
│   │   │   ├── DetailPanel.tsx      # Pod/node details panel
│   │   │   └── ToastContainer.tsx   # Toast notifications
│   │   ├── hooks/           # Custom React hooks
│   │   │   └── useWebSocket.ts      # WebSocket connection logic
│   │   ├── services/        # API clients
│   │   │   └── api.ts
│   │   ├── types/           # TypeScript types
│   │   │   └── index.ts
│   │   ├── App.tsx          # Main app component
│   │   ├── App.css          # Styles
│   │   └── main.tsx         # Entry point
│   ├── package.json
│   └── vite.config.ts
├── k8s/
│   └── test-deployment.yaml # Test deployment for demos
├── CLAUDE.md                # Detailed project vision & roadmap
└── README.md
Backend with hot reload:
cd backend
go run cmd/observatory/main.go
Frontend with hot reload:
cd frontend
npm run dev
Both will automatically reload when you make changes!
Backend:
cd backend
go build -o observatory ./cmd/observatory
KUBECONFIG=/path/to/k3s.yaml ./observatory
Frontend:
cd frontend
npm run build
# Output in dist/ folderObservatory's resource visualization features require metrics-server to be installed on your cluster. If you don't have it installed, the visualization will still work, but pods won't show size/glow based on resource usage.
k3s comes with metrics-server built-in, but it might not be enabled by default:
# Check if metrics-server is running
kubectl get deployment metrics-server -n kube-system

# If not found, k3s should have it enabled by default
# Verify with:
kubectl top nodes
kubectl top pods

# If you get errors, you may need to reinstall k3s with metrics-server enabled# Install metrics-server
kubectl apply -f https://github.com/kubernetes-sigs/metrics-server/releases/latest/download/components.yaml
# For local/development clusters (like kind, minikube), you may need to disable TLS:
kubectl patch deployment metrics-server -n kube-system --type='json' \
-p='[{"op": "add", "path": "/spec/template/spec/containers/0/args/-", "value": "--kubelet-insecure-tls"}]'
# Verify it's working
kubectl top nodes
kubectl top pods --all-namespacesOnce metrics-server is installed, Observatory will automatically start collecting and displaying resource metrics:
- Check backend logs for:
Broadcasted metrics for X pods - Observe pods changing size based on memory usage
- Watch CPU glow effects as pods consume resources
- See sidecars appear as orbiting satellites
Issue: Pods appear as fixed size with no CPU glow
Solution:
- Verify metrics-server is installed:
kubectl get deployment metrics-server -n kube-system - Test metrics API:
kubectl top pods - Check backend logs for metrics-related errors
- Ensure Observatory has RBAC permissions to access metrics API
Issue: Failed to connect to Kubernetes cluster
Solution: Make sure your KUBECONFIG environment variable points to a valid kubeconfig file:
export KUBECONFIG=/path/to/your/k3s.yamlFor k3s clusters, the kubeconfig is usually at /etc/rancher/k3s/k3s.yaml on the server.
Issue: Connection status shows "Offline" repeatedly
Solution:
- Check that the backend is running on port 8000
- Ensure no firewall is blocking WebSocket connections
- Check browser console for specific error messages
- Backend logs will show connection/disconnection events
Issue: Pods spawn at (0, 0, 0) and stay there
Solution: This happens when pods haven't been assigned to a node yet (still in Pending state). Once Kubernetes schedules them to a node, they'll receive a pod_modified event and move to orbit their assigned node.
Issue: Nodes vanish when pods are added/removed
Solution: This was fixed in recent updates. Hard refresh your browser (Ctrl+Shift+R) to ensure you have the latest frontend code.
See CLAUDE.md for the detailed project vision and feature roadmap.
Phase 1: MVP ✅ Complete
- Basic 3D visualization of nodes and pods
- Real-time WebSocket updates
- Toast notifications
- Namespace filtering
- Dynamic pod redistribution
Phase 2: Real-time Updates ✅ Complete
- WebSocket connection with auto-reconnect
- Kubernetes Watch API integration
- Live pod/node lifecycle events
- Connection health indicator
- Smooth animations for state changes
Phase 3: Resource Visualization ✅ Complete
- CPU usage shown as heat glow (blue → cyan → yellow → orange → red)
- Memory usage shown as size scaling (logarithmic)
- Sidecar containers rendered as orbiting satellites
- Real-time metrics streaming (5s interval)
- Automatic sidecar detection (istio-proxy, envoy, etc.)
- Per-container CPU/memory metrics
Phase 4: Traffic & Entry Points (Next)
- Ingress/LoadBalancers as portal gateways
- Service-based traffic flows with animated ships/particles
- Connection lines between related pods
- Traffic intensity visualization
Phase 5: Polish & Production
- Click pod/node for detailed info panel
- Search/filter pods by name or namespace
- Camera reset button and saved views
- Multiple visualization modes
- Dark/light themes
- Performance optimizations for large clusters
Contributions are welcome! Please feel free to submit a Pull Request.
- Fork the repository
- Create your feature branch (
git checkout -b feature/amazing-feature) - Commit your changes (
git commit -m 'Add some amazing feature') - Push to the branch (
git push origin feature/amazing-feature) - Open a Pull Request
This project is licensed under the General Public License 3.0 - please see the LICENSE file for details.
- Built with ❤️ for the homelab community
- Inspired by the desire to make Kubernetes monitoring beautiful and intuitive
- Special thanks to the teams behind Three.js, React Three Fiber, and client-go
- 🐛 Issues: GitHub Issues
- 💬 Discussions: GitHub Discussions
Made with 🔭 by Craig Derington
Transform your cluster into a work of art.