Before we get started, we need to install NetLogo.
NetLogo has an excellent User Manual here. The dictionary of methods is especially helpful.
The Bass Model is a model of product adoption created by Frank Bass. The adoption of a product can be thought of as a diffusion of the product through some population of individuals. Bass assumed that individuals adopted a new product based on one of two reasons: an advertising effect, denoted p, or a word-of-mouth effect, denoted q. The first is controlled by the firm producing the product, and thus exogenous. The second is dictated by the individuals being marketed to, and thus endogenous. The original Bass Model was formulated as an ordinary differential equation, and therefore assumed a 'well-mixed' population of individuals. The differential equation for the proportion who have adopted F(t) follows a logistic growth-like model:

We see that the rate of product adoption is dictated by a constant advertising effect p and a word-of-mouth effect qF(t) that increases as the number F(t) who have adopted increases. The solution to the Bass model resembles an S-shaped (sigmoidal) adoption curve. The total proportion of individuals who have adopted the product by time t follows:

which plotted against time looks like:
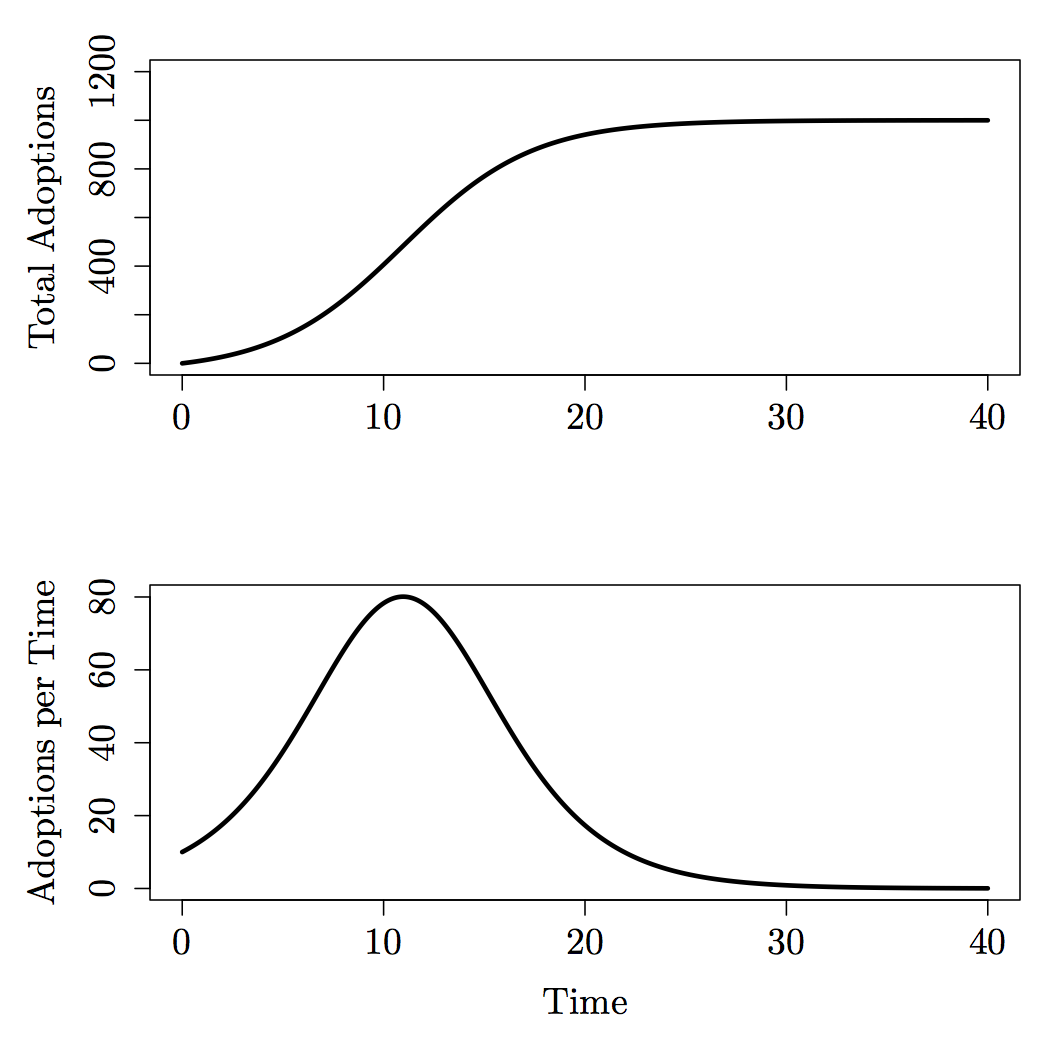
where the top curve shows the total number of adoptions to date, and the bottom curve shows the number adopted per unit time.
You can find Bass's original paper here.
We will consider an agent-based version of the Bass model, where instead of individuals being well-mixed, they are constrained to lie on a network. For example, we might expect this sort of constraint on social media, where an individual's word-of-mouth influence is limitted by the number of connections friends / followers they have.
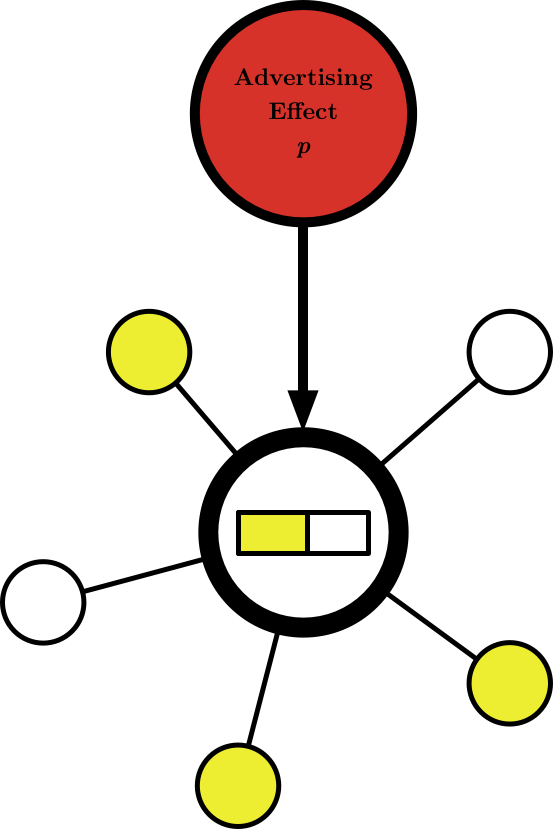
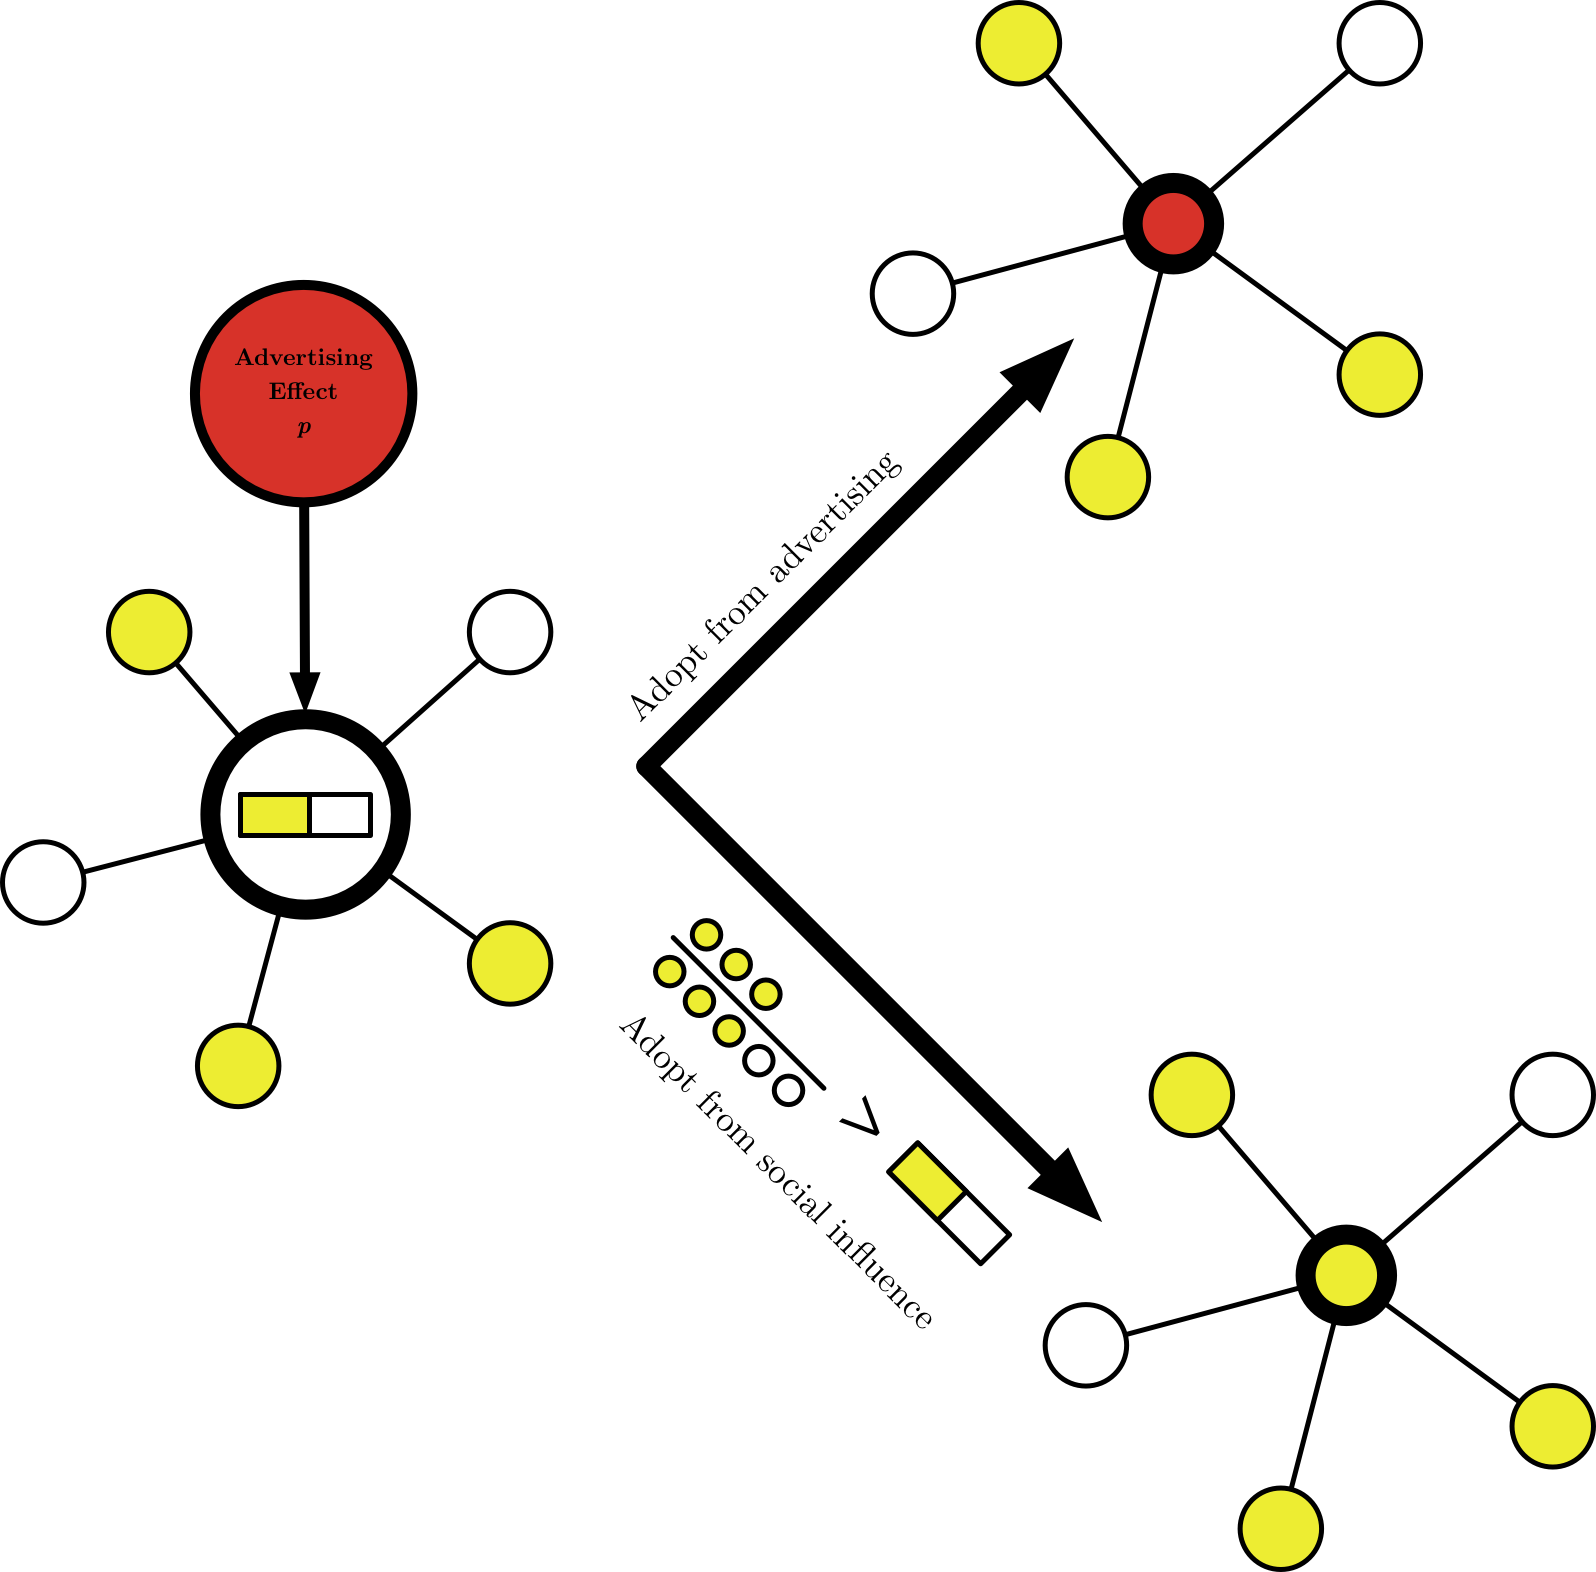
Like Bass's original model, our model also has an advertising effect, called broadcast-influence in the NetLogo model, and a word-of-mouth effect, called social-influence in the NetLogo model. At each time step, we scan through the agents that have yet to adopt, and they either adopt with probability broadcast-influence, or adopt with a probability social-influence times the proportion of their neighbors who have adopted. Thus, the more of their neighbors have adopted, the more likely they are to adopt. We can represent this schematically as below:
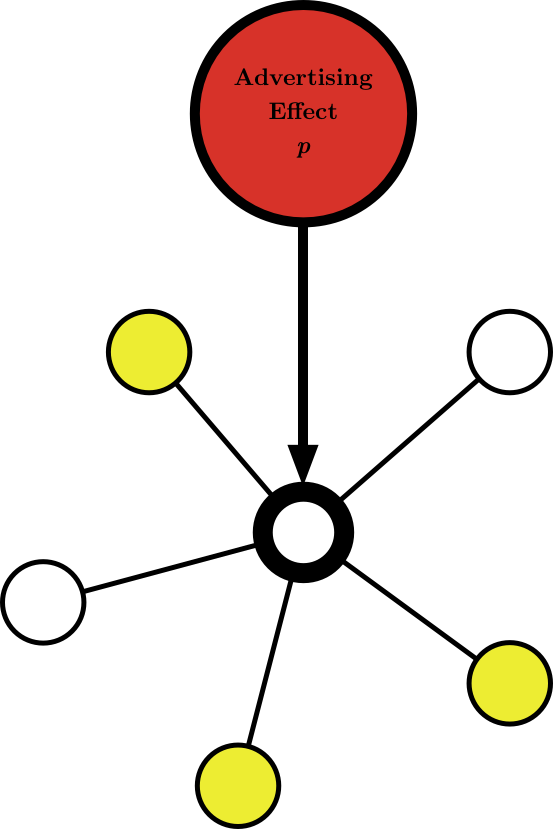
The current agent, center, has yet to adopt. We first give the agent a chance to adopt from advertising. If the agent does not adopt from advertising, then we give the agent a chance to adopt from word-of-mouth effects from its neight. Thus, one of three outcomes can occur:

Let's take a look at the model in NetLogo. Open bass-abm.nlogo in the models directory of this page.
As our second model of diffusion, we consider the Linear Threshold Model. The Linear Threshold Model was first proposed by the sociologist Mark Granovetter in his 1978 paper "Threshold Models of Collective Behavior." In this paper, Granovetter sought to explain wide ranging phenomena from the diffusion of innovation (like Bass) to the spread of rumors to the election of political candidates.
To do so, he supposed that each agent in his model has a particular threshold for co-agents above which it will make the same decision of the co-agents and below which it will not. Moreover, he assumed that these thresholds varied across agents according to some distribution. He found that such a model could generate phenomena similar to formation of riots in crowds, the bandwagon effect in politics, and the adoption of new technology in society. In particular, all of these phenomena can exhibit 'tipping point'-like behavior, where a small perturbation in the initial threshold distribution can lead to drastically different outcomes. Hence the name of Malcolm Gladwell's 2000 book The Tipping Point.
The dynamics of this model take a very different form from Bass's. Unlike the Bass model, in the linear threshold model, the decision to adopt is deterministic, while the rule for adopting is random. That is, each agent in the network has a threshold drawn randomly from some underlying distribution, and this threshold determines what proportion of neighbors must adopt before they do. Below that threshold, the agent never adopts the product. Above the threshold, the agent always adopts the product.
We can represent this model schematically as follows:
We see that the center agent has a threshold of 50%: it will only adopt the product if 50% or more of its neighbors have adopted. In this case, because 3/5 of the neighbors have adopted, the agent will certainly adopt the product. If 0/5, 1/5, or 2/5 of the neighbors had adopted, the agent would not adopt the product due to word-of-mouth effects. As with the Bass model, we also incorporate advertising effects. Thus, the possible outcomes for this situation are shown below:
Let's take a look at the model in NetLogo. Open threshold-abm.nlogo in the models directory of this page.
As our final example, we will consider the Independent Cascade Model for diffusion in a network. As the name suggests, this model is used to how the adoption of some product cascades through a network. As we will see, it is similar to both the Bass and Linear Threshold models, with some key differences. It was first proposed by Jacob Goldenberg, Barak Libai, and Eitan Muller in their 2001 paper "Talk of the Network: A Complex Systems Look at the Underlying Process of Word-of-Mouth" as a model for the spread of word-of-mouth phenomena.
The Independent Cascade Model can be described in terms of an agent changing its state because of the states of its neighbor, as we have done with both the Bass and Linear Threshold models, or in terms of an agent passing its state to its neighbor. We will consider the second perspective, since it is one we have not encountered yet. From this perspective, the unit of study is an agent who is already in the adopted state. In this case, the agent can has a single chance to influence each of its neighbors who have not yet adopted. Each of its neighbors adopt with some fixed probability, independently from the other neighbors (hence 'independent' cascade). In addition, there is an exogenous marketing effect as we have incorporated into both the Bass and Linear Threshold models.
Let's consider how the endogenous word-of-mouth spread occurs for a single agent. We consider the same setup as for the Bass and Linear Threshold models:
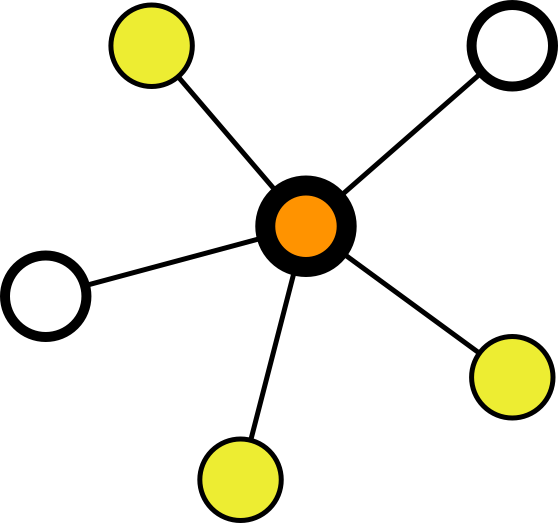
except now we are considering how the central agent (colored orange to indicate that it has just adopted) can spread its adoption to its neighbors. The central agent will query each of its neighbors, and they will adopt with the probability given by the influence rate. Thus, one of four outcomes can occur. Either none of the agents adopt, one or the other adopts, or both adopt, as shown below:
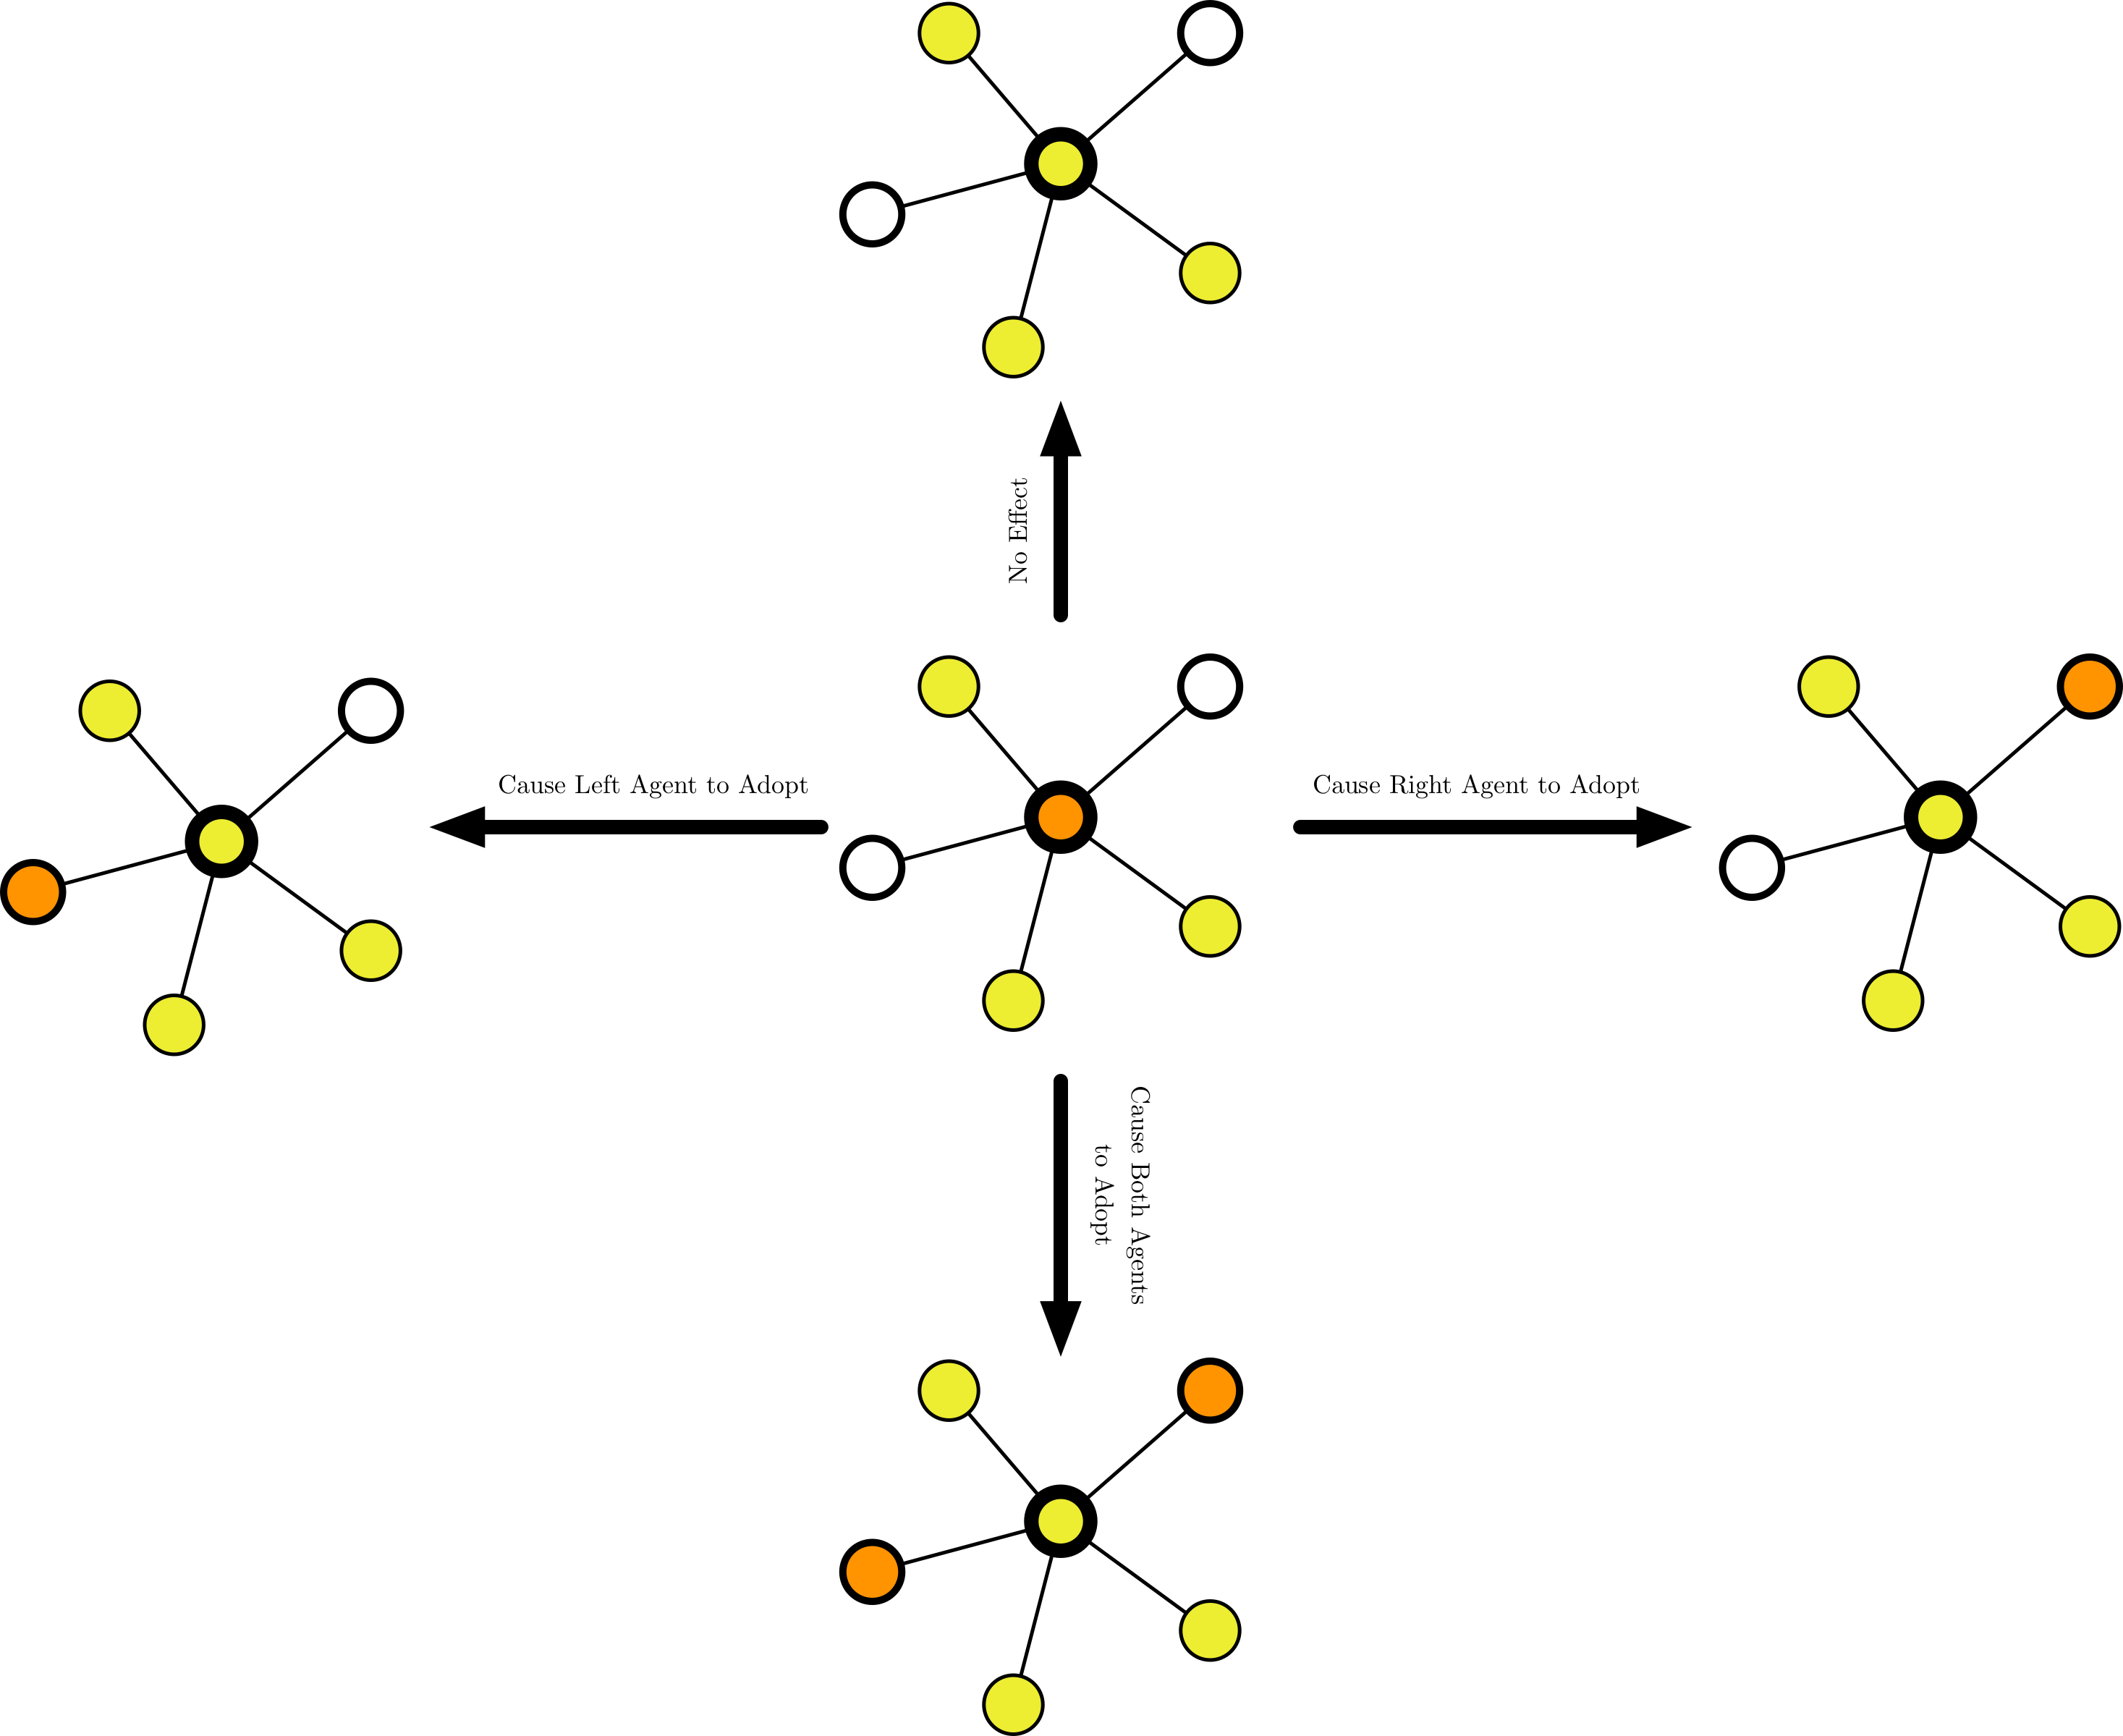
After each of the agents has had a chance to spread the adoption, the unadopted agents will adopt with a probability dictated by the advertising effect.
Let's take a look at the model in NetLogo. Open ic-abm.nlogo in the models directory of this page.
Now that we've gained some familiarity with each of the models and their parameters, let's run some experiments with each of the models.
While you can easily run one-of experiments in the NetLogo GUI, for more systematic analysis, NetLogo provides BehaviorSpace. BehaviorSpace allows you to vary
Go to the menu item Tools > BehaviorSpace. There are already two experiments saved in BehaviorSpace for this model: one investigating how the mean degree of the network impacts the rate of adoption, and another investigating how the level of social influence impacts the rate of adoption.
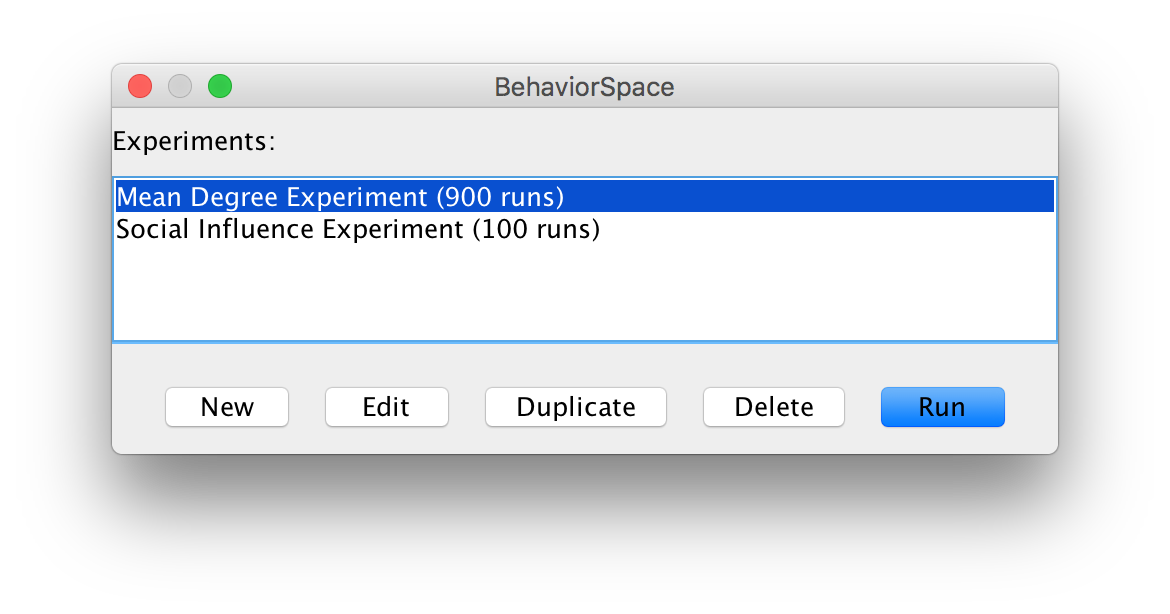
Select the Mean Degree Experiment, and click Edit.
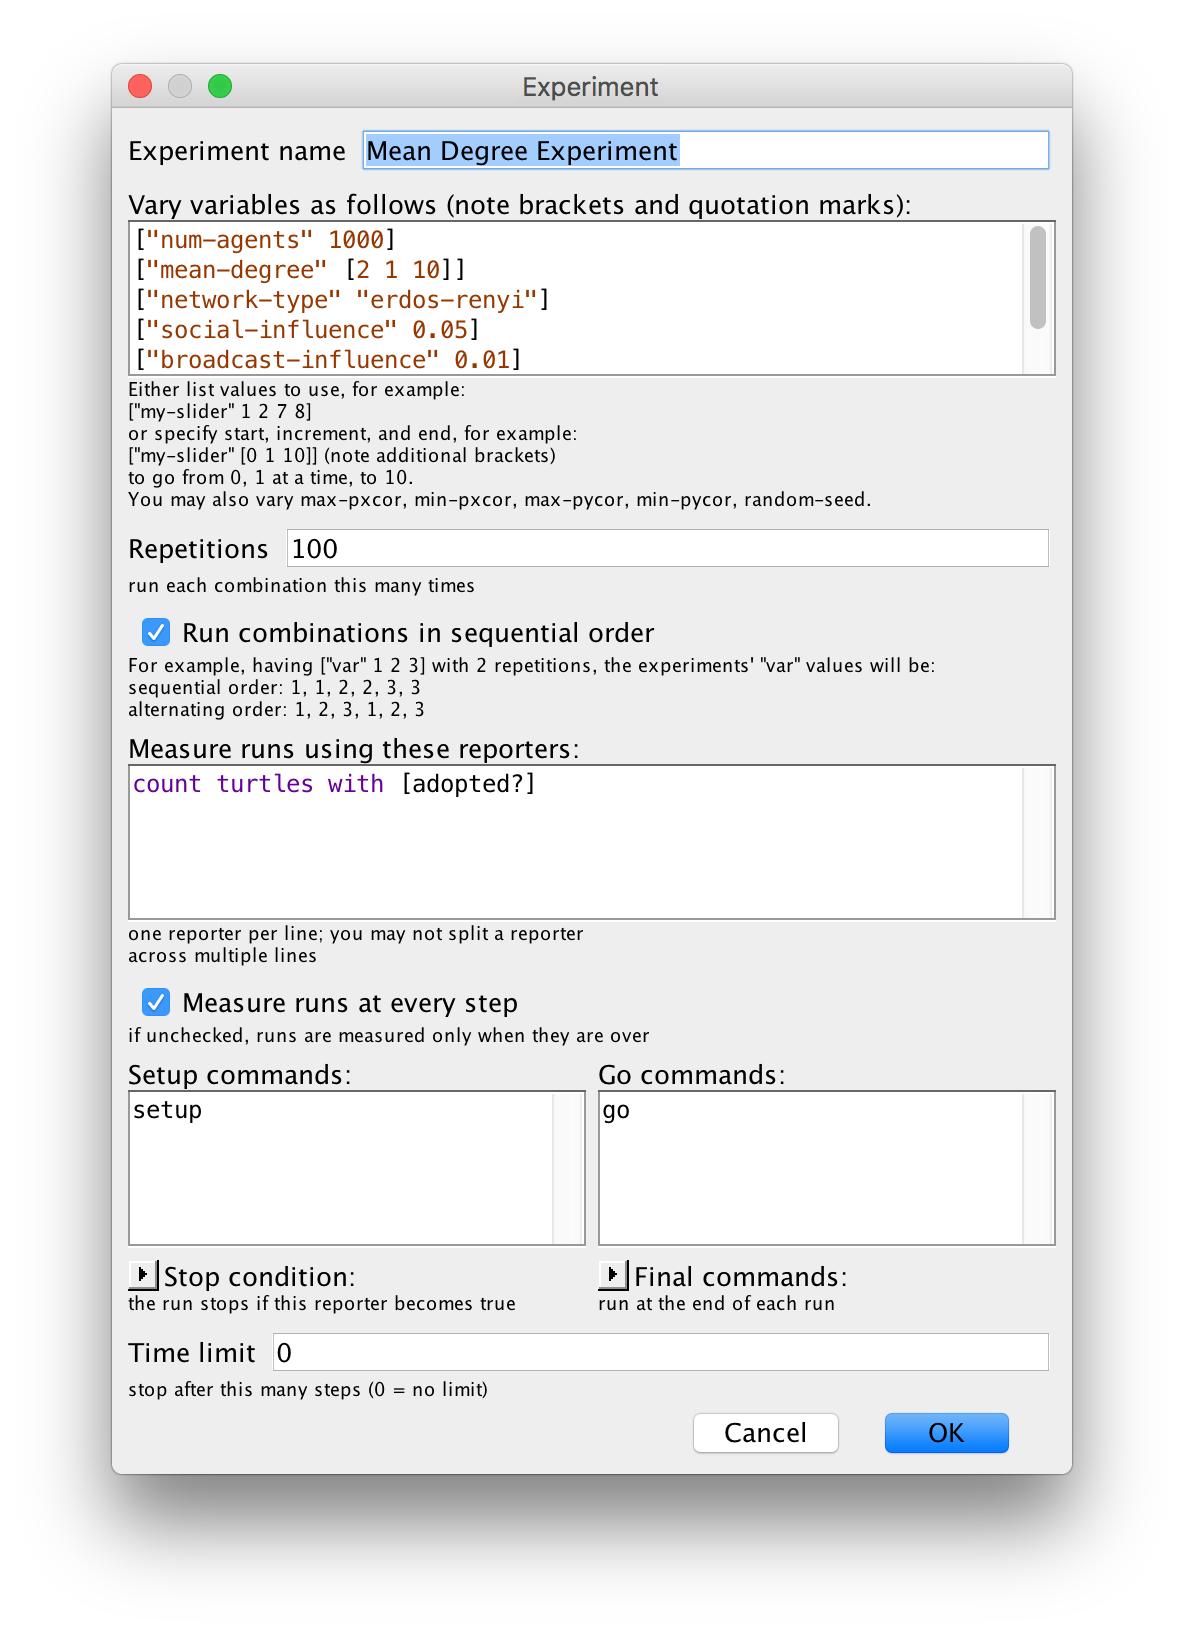
The Experiment box allows you to set up the experiment you wish to run. The text box includes the parameters of the model, and the values they will take. For example, we see that num-agents is fixed at 1000 for all runs. You can vary a parameter by passing the list [from by to] as the parameter value. For example, in this case we see that mean-degree will vary from 2 to 10 in increments of 1. Repititions sets the number of times the model will be run per parameter value.
The "Measure runs using these reporters:" text box is where we enter the quantity we wish to track over the course of a trial. In this case, it is set to
count turtles with [adopted?]
Recalling that adopted? is a boolean that is false if the agent has not adopted and true if the agent has, this will count the number of adopted who have adopted at each time point.
Click OK to close out the dialog box. Then click Run. Make sure that Table Output is selected, and click OK. Use the provided file name, and save the file in the GitHub folder sfinsc-day2-master.
Explore: Open
bass-abm Mean Degree Experiment-table.csvin Sublime Text. What is the layout of this file? Which column contains the number of agents who have adopted at a given time step? What do you notice about the ordering of the trials?
Explore: Open RStudio, and change the working directory to
sfinsc-day2-masteron your machine. Run thebehavior-space-script-aggregate_runs.Rscript to analyze the BehaviorSpace experiments.
Pointer: For BehaviorSpace file you analyze, you will only be changing the assignments to
bs.dataandparam.name. Loadbs.datausing the path to the BehaviorSpace file, and setparam.nameto the name of the parameter you varied in the BehaviorSpace experiment.
Hint: When R imports the data, it will change hyphens to periods. Thus,
mean-degreewill becomemean.degree.
Hint: You may also want to change
xlim.use, which controls the horizontal limits for the plot, to zoom in / zoom out.
Explore: Open RStudio, and change the working directory to
sfinsc-day2-masteron your machine. Run thebehavior-space-script-aggregate_runs.Rscript to analyze the BehaviorSpace experiments.
Explore: How does changing the mean degree of either the Erdős-Rényi or the Watts-Strogatz network models effect the spread of product adoption through the network? Use the Mean Degree Experiment in BehaviorSpace to investigate, and analyze the results using both the
behavior-space-script-aggregate_runs.Randbehavior-space-script-individual_runs.Rscripts. What line of the "Vary variables as follows" text field dictates the mean degrees to experiment with?
Explore: How does changing the social influence impact the average time until total adoption? Use the Social Influence Experiment in BehaviorSpace to investigate, and analyze the results using both the
behavior-space-script-aggregate_runs.Randbehavior-space-script-individual_runs.Rscripts. What line of the "Vary variables as follows" text field dictates the social influence to experiment with?
Pointer: For the remainder of the explorations, after some initial investigation with the sliders, use BehaviorSpace to run an experiment with multiple trials and then use both the
behavior-space-script-aggregate_runs.Randbehavior-space-script-individual_runs.Rscripts to analyze those results.
Explore: How does the heterogeneity of the threshold distribution effect the tipping point effect? Try making the distribution entirely homogeneous: set the min and max values of the threshold distribution to the same value. Try making the distribution as heterogeneous as possible: set the min value to 0 and the max value to 1.
Explore: How do the threshold distribution and mean degree of the nodes interact?
Explore: Holding all other parameters the same, how does the product adoption vary with the network type? Why might tipping point-like behavior be more common with one of the network types than another?
Explore: How does the cascade behave when the broadcast-influence is zero?
Explore: Can you find a value of social-influence such that the cascade is very likely to spread through the entire network, even when the broadcast-influence is zero?
Explore: How does the size of the initial cascade depend on the number of seed adopters in the network?
Explore: How is the preferential attachment network different from the other two network types? Which diffusion models are most impacted by this difference? Hint: How does its degree distribution differ from the Erdős-Rényi and the Watts-Strogatz network models? And how would that effect the update rules for the different diffusion models?
We have developed three very different models of how the adoption of a product can spread through a network of agents. We have seen that, though the models behave similarly, they differ in important ways. For example, the Linear Threshold Model is sensitive to tipping points, and the Independent Cascade Model results in a large initial cascade of adoption through the network. The actual behavior of human agents will be more complicated than any of these three models, and likely any model, but the abstractions of the model may still help understand and guide their behavior.
For our final exploration, we consider the diffusion of product adoption on a network collected from Facebook. The directory model-selection-data has twenty time series of (simulated) product adoption occuring on this network.
Explore: Use the script
model-selection-script.Rto visualize this data.
Suppose that in addition to knowing the network, you also know that through marketing efforts, the following parameters can be fixed at:
- num-seed-adopters: 10
- broadcast-influence: 0.001
Your goal is to determine which model gives qualitative behavior similar to the observed adoption patterns, and what tunable parameter values lead to simulated adoptions that most closely matches observed adoptions.
Explore: Compare your visualization of the data to what you expect from each model class. Given your best guess at the appropriate model, tune the parameters of that model to generate adoption curves that most closely match the observed data.