Welcome to the Water Quality Monitoring System project! This system is designed to monitor, analyze, and visualize various parameters of water bodies in real-time while providing tools to handle water quality-related issues effectively. The system integrates IoT for sensor data collection, machine learning (YOLO) for microplastic detection, and a React-based frontend for intuitive user interaction.
- Backend: Node.js, Express, Flask 🔧
- Database: MongoDB Cloud 💾
- Machine Learning: YOLO for microplastic detection 🤖
- Frontend: React ⚛️
- Hardware: ESP32, various sensors (temperature 🌡️, turbidity 🌫️, TDS 💧), camera for live monitoring 🎥
- APIs: Custom APIs for real-time data collection and ML model serving 🚀


-
📊 Dashboard
- Displays key metrics, including recent tests and budget utilization vs. allocation for various departments.
- Highlights recent test results with severity-level annotations for easy assessment.
- Notifications for significant spikes in water quality parameters, ensuring timely intervention.
-
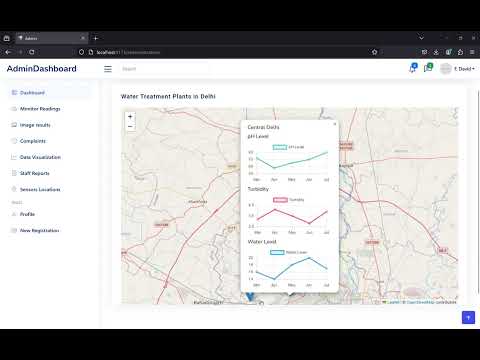
📈 Real-Time Water Body Monitoring
- Real-time monitoring of water quality parameters like pH, Ammonia, TDS, and Temperature.
- Interactive, color-coded charts with hover effects and filters for location and time span.
- Zoom-in/zoom-out features for data granularity analysis.
-
🤖 ML-Based Test Results
- Test results from backend ML algorithms analyzing live footage and uploaded photos.
- Detects pollutants such as algae, microplastics, and other contaminants harmful to water quality.
-
📬 Complaints Management
- Manage public complaints regarding water quality issues by filtering them based on location.
- Helps prioritize problem areas for timely resolution.
-
📊 Data Visualization
- Advanced tools to analyze trends in water quality, compare multiple parameters, and customize graph types.
- Facilitates evidence-based decision-making through flexible visualization options.
-
📄 Staff Reports
- Access detailed test reports uploaded by staff, annotated with water quality statuses (e.g., "Danger", "Normal").
- Filter reports by location for focused analysis.
-
🗺️ Interactive Map
- Visualize water body locations on an interactive map, showing real-time status and parameters.
- Zoom-in/zoom-out navigation for better usability.
-
📝 Report Submission
- Staff can submit detailed reports with water quality test results using various methodologies like membrane filtration.
-
📷 Photo Upload
- Upload photos of water bodies for ML model analysis, detecting pollutants like microplastics and algae.
-
📂 User Test History
- Access and review the history of tests conducted, helping to track water quality trends and ensure consistent reporting.
- The MongoDB Cloud database stores all data securely, including sensor data, test results, and microplastic contamination insights.
- A scalable solution for efficient data storage and management.
- Created custom RESTful APIs to handle data fetching, posting, and real-time updates.
- APIs allow seamless communication between the ESP32 hardware unit and the server, enabling the collection of real-time data from water bodies.
- APIs also manage the storage and retrieval of data for graph generation and static data requests.
- Used YOLO-based machine learning models to detect microplastic algae contamination in water bodies from camera footage.
- A Flask server is used to serve the YOLO model, with API endpoints allowing users to send images for analysis.
- 🌊 YOLO is used to detect microplastic algae contamination in water bodies via camera images.
- 🔍A Flask server exposes APIs for model interaction, processing images to detect contaminants.
- 🌡️💧 ESP32 collects data from temperature, turbidity, TDS, and other sensors.
- Camera captures live footage, processed by the YOLO model for contamination detection.
- 🎥 Data from the sensors and camera is sent to the server for analysis. 💬
- 📊 React-based frontend displays real-time data and test results, offering a user-friendly interface.
- 🚨 Visual insights on water quality and contamination status to help users make informed decisions.
- Data Collection: The ESP32 collects data from sensors and the camera feed, which is sent to the server via APIs. 🌍
- Real-Time Processing: The server processes the data, running the YOLO model to detect contamination. ⚡
- Data Storage: Collected data is securely stored in MongoDB Cloud for analysis and reporting. 💾
- Live Dashboard: The React frontend fetches and displays real-time data, showing water quality metrics and microplastic contamination results on the dashboard. 📲
🙏 Thanks to Contributors 🙏