Releases: rohankumawat/spotifyStreamlit
Release v0.1
Release v0.1: Spotify Recommendation Streamlit Integration
spotifyStreamlit is an open-source project focused on analyzing Spotify data using Streamlit. This project aims to provide Spotify users with insightful data analysis through an interactive Streamlit interface.
Last Release: v0.0.2
The last release of spotifyStreamlit is tagged as v0.0.2. This release enhanced the navigation of the website using page-based UI, included Clustering Visualisations and improved graph aesthetics.
Features in v0.0.2:
- Enhanced Navigation through Page-based UI
- Sophisticated Data Analysis with 2D/3D Clustering Visualizations
- Improved Graph Aesthetics
- The detailed description and assets for this release can be found on the releases page.
Release: v0.1
Following the 0.0.2 release, the project has continued to evolve with additional commits and improvements. This release, v0.1 includes:
- Recommendation Page
- Clustering
Contribution
We welcome contributions to the spotifyStreamlit project. Whether you're interested in fixing bugs, adding new features, or improving documentation, your help is appreciated.
- Please see the CONTRIBUTING.md file for guidelines on how to contribute.
- We also have a Code of Conduct that we expect all participants to adhere to.
- Clustering Notebook.
- Recommendation Notebook.
For those interested in the data analysis aspect of the project, we provide a clustering notebook as a reference. This notebook demonstrates how to apply clustering algorithms to Spotify data, offering a practical example of the project's capabilities.
License
This project is licensed under the MIT License - see the LICENSE file for details.
Community
As an open-source project, spotifyStreamlit thrives on community involvement. We encourage you to:
- Star the project on GitHub.
- Contribute to the codebase.
- Share your feedback and suggestions.
- Your participation helps us grow and improve!
Release v0.0.2: Interactive Insights
Release v0.0.2: Interactive Insights
spotifyStreamlit is an open-source project focused on analyzing Spotify data using Streamlit. This project aims to provide Spotify users with insightful data analysis through an interactive Streamlit interface.
Last Release: v0.0.1
The last release of spotifyStreamlit is tagged as v0.0.1. This initial alpha release marks the foundational build of the project, establishing the core features and setting the stage for future enhancements.
Features in v0.0.1:
- Enhanced data analysis features.
- Improvements in the Streamlit interface.
- Bug fixes and performance optimizations.
- Stay tuned for the official release announcement and additional details.
- The detailed description and assets for this release can be found on the releases page.
Release: v0.0.2
Following the 0.0.1 release, the project has continued to evolve with additional commits and improvements. This release, v0.0.2 includes:
- Enhanced Navigation through Page-based UI
- Sophisticated Data Analysis with 2D/3D Clustering Visualizations
- Improved Graph Aesthetics
Contribution
We welcome contributions to the spotifyStreamlit project. Whether you're interested in fixing bugs, adding new features, or improving documentation, your help is appreciated.
- Please see the CONTRIBUTING.md file for guidelines on how to contribute.
- We also have a Code of Conduct that we expect all participants to adhere to.
- Clustering Notebook.
For those interested in the data analysis aspect of the project, we provide a clustering notebook as a reference. This notebook demonstrates how to apply clustering algorithms to Spotify data, offering a practical example of the project's capabilities.
License
This project is licensed under the MIT License - see the LICENSE file for details.
Community
As an open-source project, spotifyStreamlit thrives on community involvement. We encourage you to:
- Star the project on GitHub.
- Contribute to the codebase.
- Share your feedback and suggestions.
- Your participation helps us grow and improve!
Second Release
Release v0.0.1: Initial Release - Spotify Data Analysis Tool
spotifyStreamlit is an open-source project focused on analyzing Spotify data using Streamlit. This project aims to provide Spotify users with insightful data analysis through an interactive Streamlit interface.
Last Release: v0.0.1-alpha
The last release of spotifyStreamlit is tagged as v0.0.1-alpha. This initial alpha release marks the foundational build of the project, establishing the core features and setting the stage for future enhancements.
Features in v0.0.1-alpha:
-
Basic implementation of Spotify data analysis.
-
Initial Streamlit interface setup.
-
The detailed description and assets for this release can be found on the releases page.
Release: v0.0.1
Following the alpha release, the project has continued to evolve with additional commits and improvements. This release, v0.0.1 includes:
-
Enhanced data analysis features.
-
Improvements in the Streamlit interface.
-
Bug fixes and performance optimizations.
-
Stay tuned for the official release announcement and additional details.
Contribution
We welcome contributions to the spotifyStreamlit project. Whether you're interested in fixing bugs, adding new features, or improving documentation, your help is appreciated.
-
Please see the CONTRIBUTING.md file for guidelines on how to contribute.
-
We also have a Code of Conduct that we expect all participants to adhere to.
For those interested in the data analysis aspect of the project, we provide a clustering notebook as a reference. This notebook demonstrates how to apply clustering algorithms to Spotify data, offering a practical example of the project's capabilities.
License
This project is licensed under the MIT License - see the LICENSE file for details.
Community
As an open-source project, spotifyStreamlit thrives on community involvement. We encourage you to:
-
Star the project on GitHub.
-
Contribute to the codebase.
-
Share your feedback and suggestions.
-
Your participation helps us grow and improve!
First release
Release v0.0.1: Initial Release - Spotify Data Analysis Tool
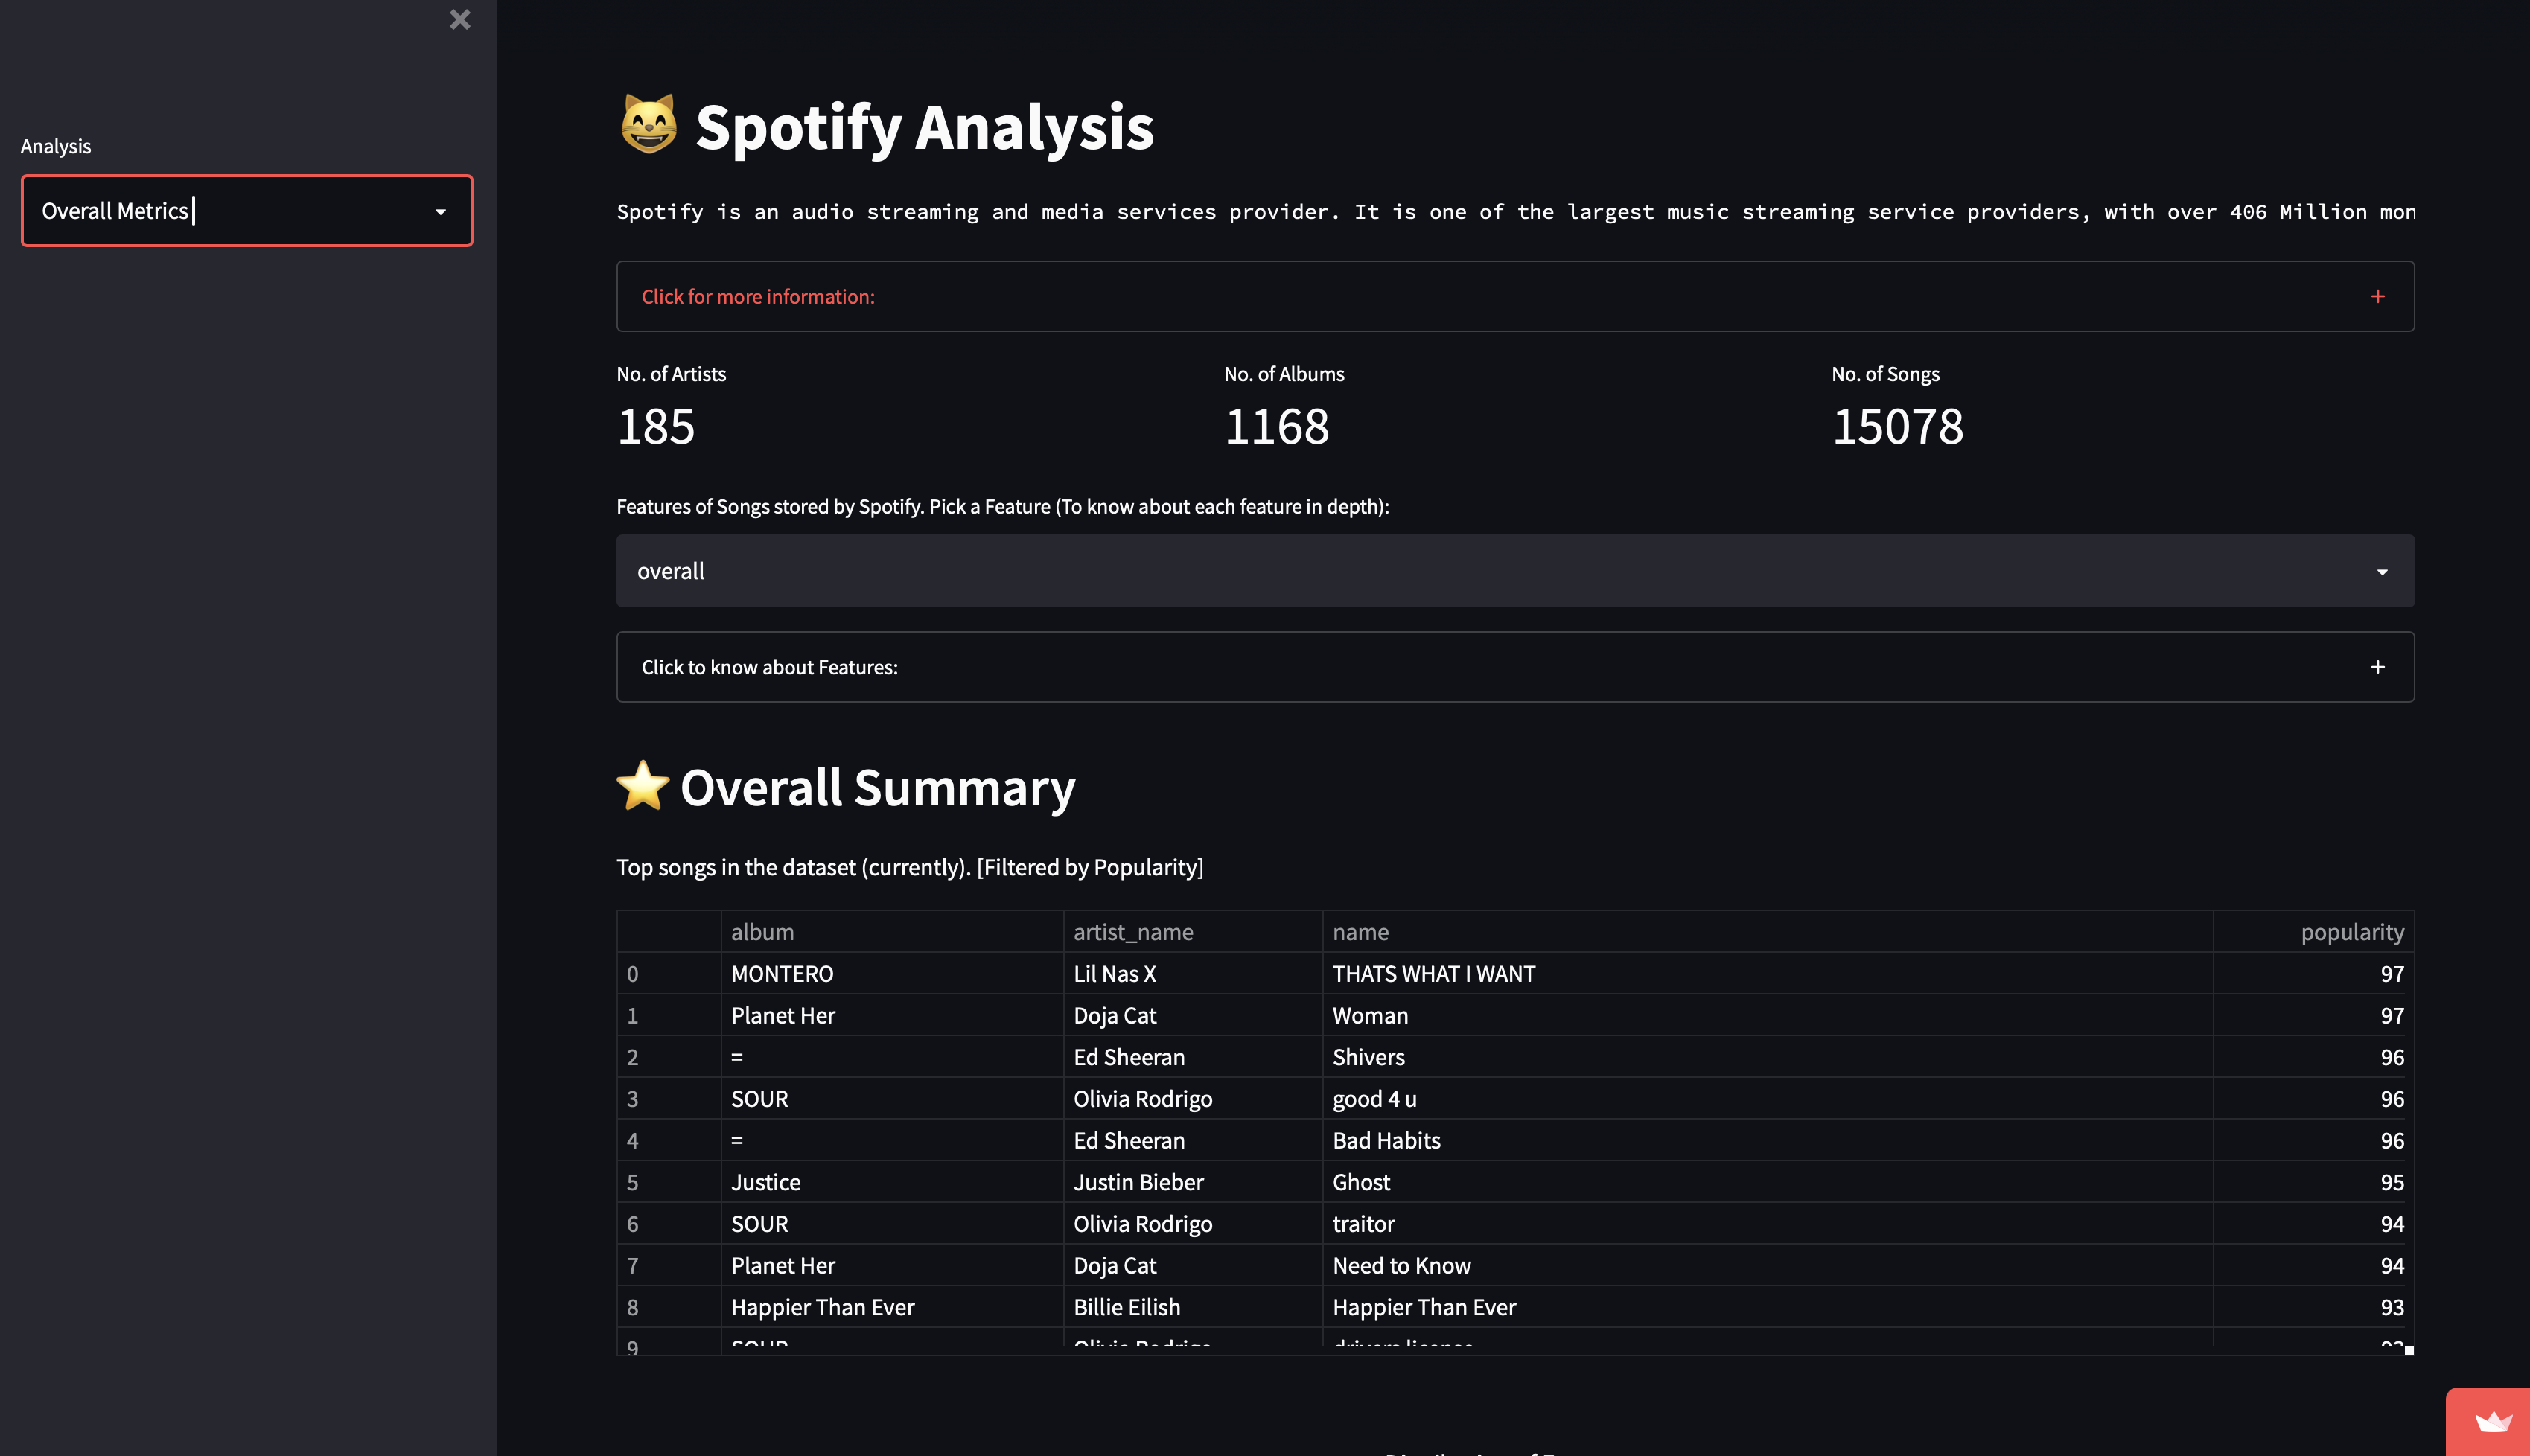
We are excited to announce the initial release of our Spotify Data Analysis application, version v0.0.1. This release marks the first step in providing insightful analytics on Spotify's dataset of 15,000 songs.
Key Features:
Overall Metrics: Explore a high-level view of the dataset, with metrics such as acousticness, danceability, energy, and more, visually represented to understand the distribution across the dataset.
Top 50 Songs: A detailed table showcasing the top 50 songs from the dataset, ranked by popularity.
Artist Analysis: Dive into specific artist data with a few clicks. Choose an artist from the drop-down menu and access visualizations showing the unique characteristics of their songs.
Album Analysis: (Coming Soon) In-depth analysis of albums, providing a closer look at the compilation level.
Clustering & Recommendation: (In Development) Future updates will include advanced features like song clustering and personalized song recommendations.
This version is a foundation for future enhancements and we're excited about the journey ahead. We welcome feedback and suggestions as we continue to develop and improve the Spotify Data Analysis tool.
Full Changelog: https://github.com/rohankumawat/spotifyStreamlit/commits/v0.0.1-alpha