An open-source uptime monitoring system built with Next.js, MongoDB, and TypeScript. Monitor your websites and services with real-time uptime tracking, alerts, and beautiful public status pages.

This project consists of three main components:
- Server (root directory) - Next.js web dashboard + API backend
- Mobile App - Flutter mobile app for Android/iOS with push notifications
- Relay - FCM relay service for push notifications
📖 For detailed setup, configuration, and development guides for each component, please refer to their respective README files linked above.
- HTTP/HTTPS Monitoring - Monitor any HTTP or HTTPS endpoint with customizable check intervals
- Real-time Alerts - Get notified via email, webhooks, or phone calls when your services go down
- Multi-Tenant Support - Run in single-tenant (private) or multi-tenant (SaaS) mode
- Passwordless Authentication - Secure email OTP login with 30-day sessions
- Team Management - Invite users with role-based access control (owner, admin, member)
- Mobile App - Native Flutter app for Android/iOS with push notifications (Google Play | App Store)
- Public Status Pages - Create beautiful, branded status pages for your services
- Historical Analytics - Track uptime percentages and response times over 24h, 7d, and 30d periods
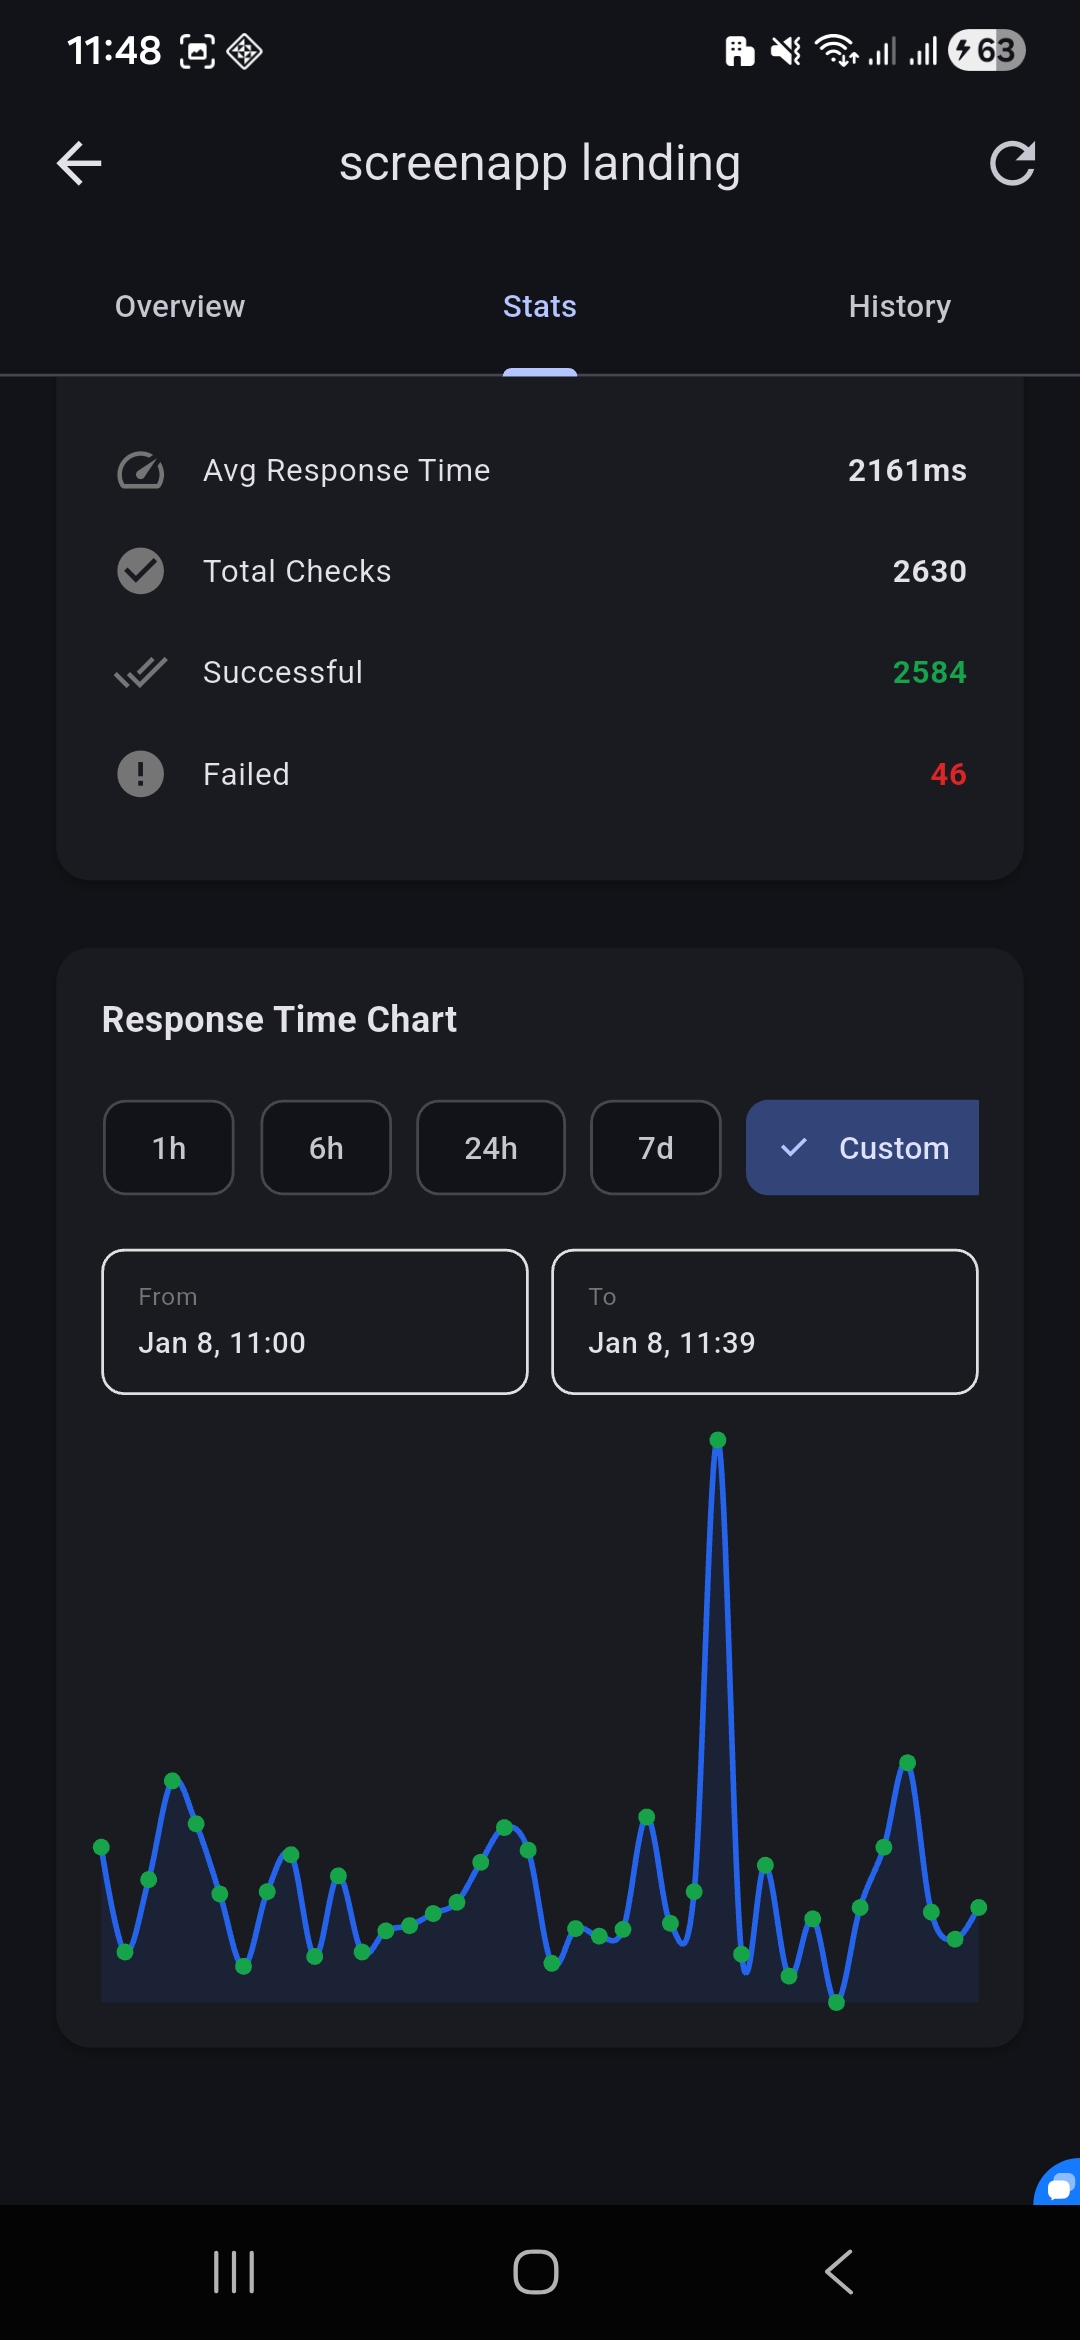
- Response Time Tracking - Visualize response times with interactive charts (red dots for failures)
- Incident Reports - Automatic incident detection and tracking
- Contact Lists - Organize alert recipients into reusable contact lists
- Self-hosted - Full control over your monitoring data
- Open Source - MIT licensed, contribute and customize freely
The monitoring system uses a unified API-based architecture for maximum flexibility:
Core API Endpoint: /api/cron/monitor
- Fetches all active monitors from MongoDB
- Checks each endpoint sequentially
- Saves check results with response time and status
- Sends alerts (email/webhook/phone) when status changes from up → down
Cron Triggers (choose based on your deployment):
| Deployment | Trigger Method | How it Works |
|---|---|---|
| Docker (Dev) | cron-monitor.sh |
Shell script calls API every minute via curl |
| AWS Lambda | EventBridge | Lambda function calls API every minute |
| Vercel | Vercel Cron | Built-in cron calls API every minute |
| Manual | System Cron | Your own cron job calls API endpoint |
Benefits of API-based approach:
- ✅ Single source of truth - all monitoring logic in Next.js app
- ✅ Easy to test - just call the API endpoint
- ✅ Flexible deployment - works with any cron service
- ✅ No code duplication - same logic everywhere
- ✅ Simple debugging - check API logs, not scattered cron logs
Visual Feedback:
- Response time charts show green dots for successful checks
- Red dots indicate failures, making issues easy to spot
- Hover over dots to see exact response time and status
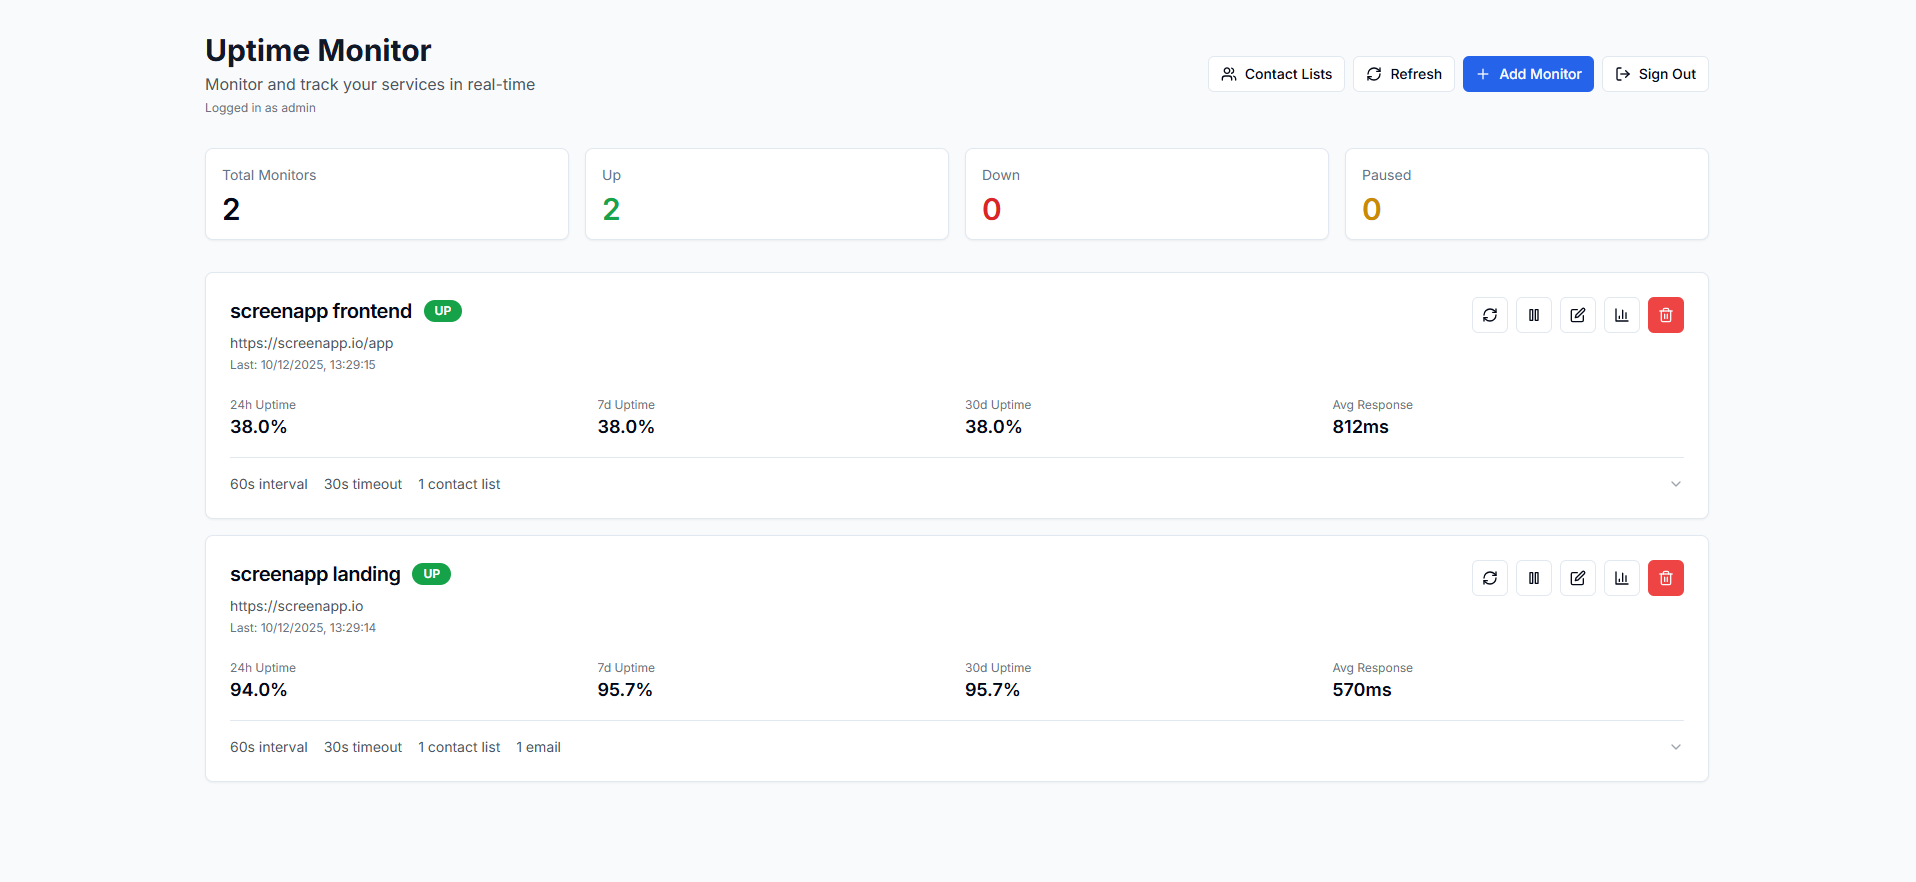
The main dashboard shows all your monitors at a glance with status indicators and uptime statistics.
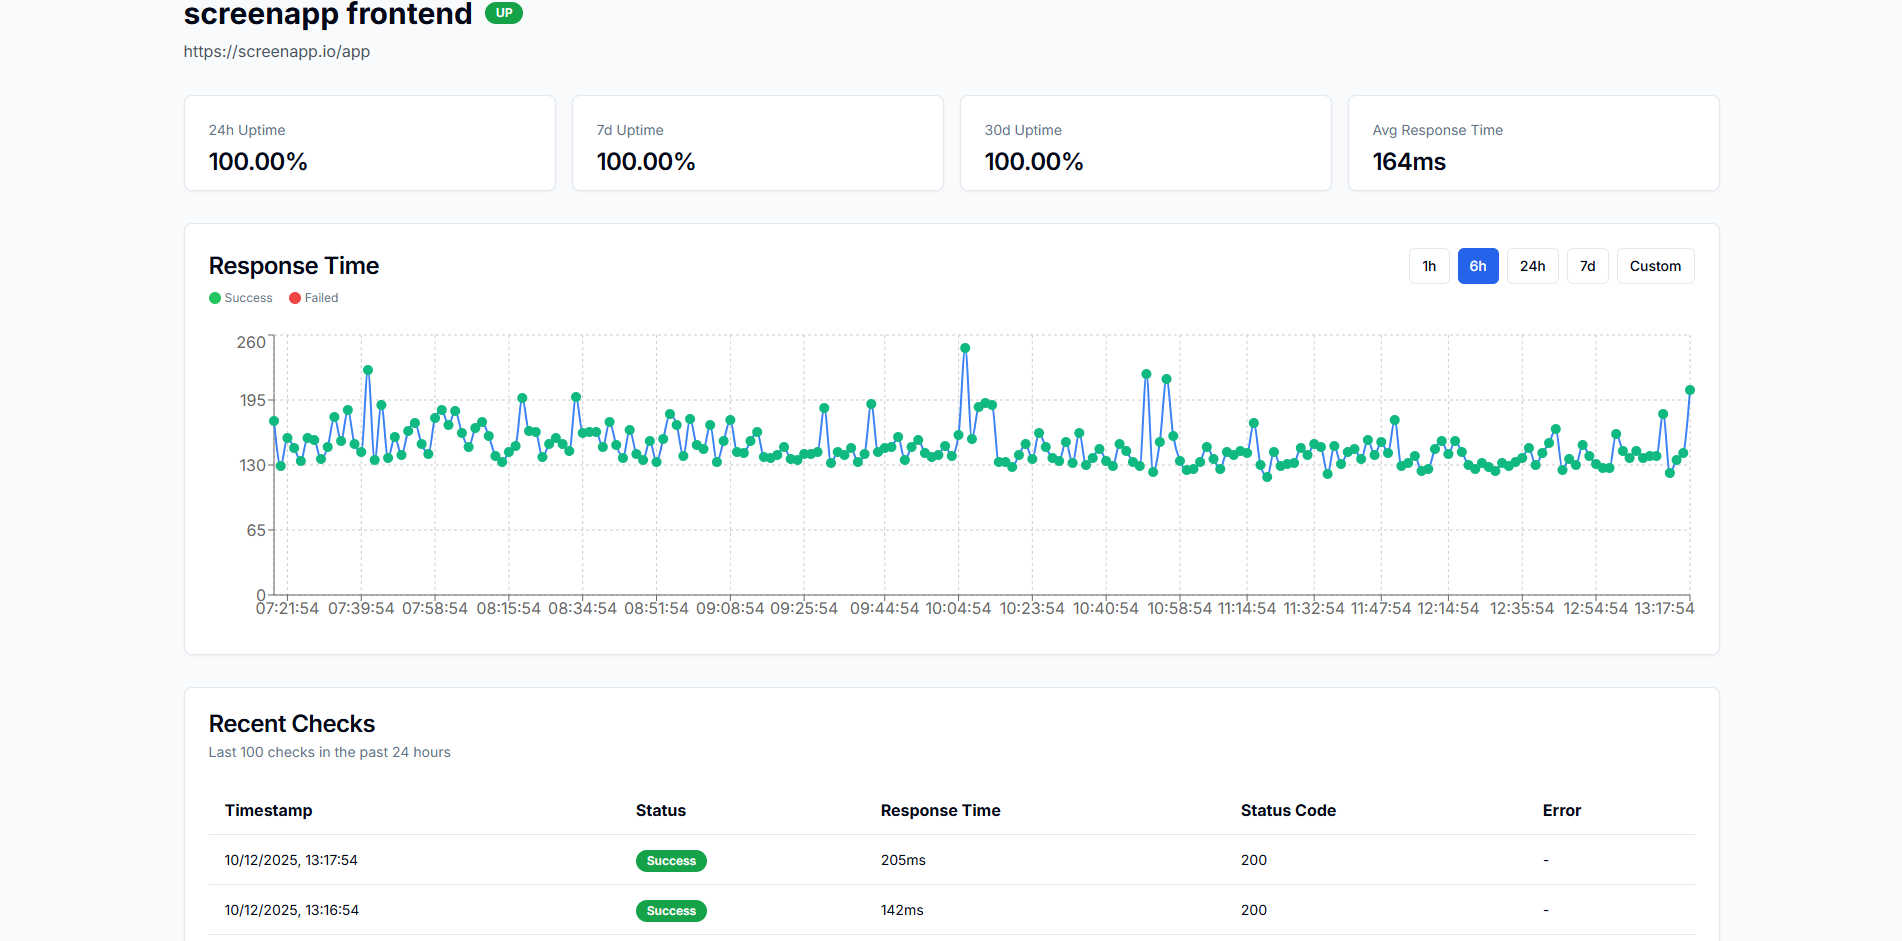
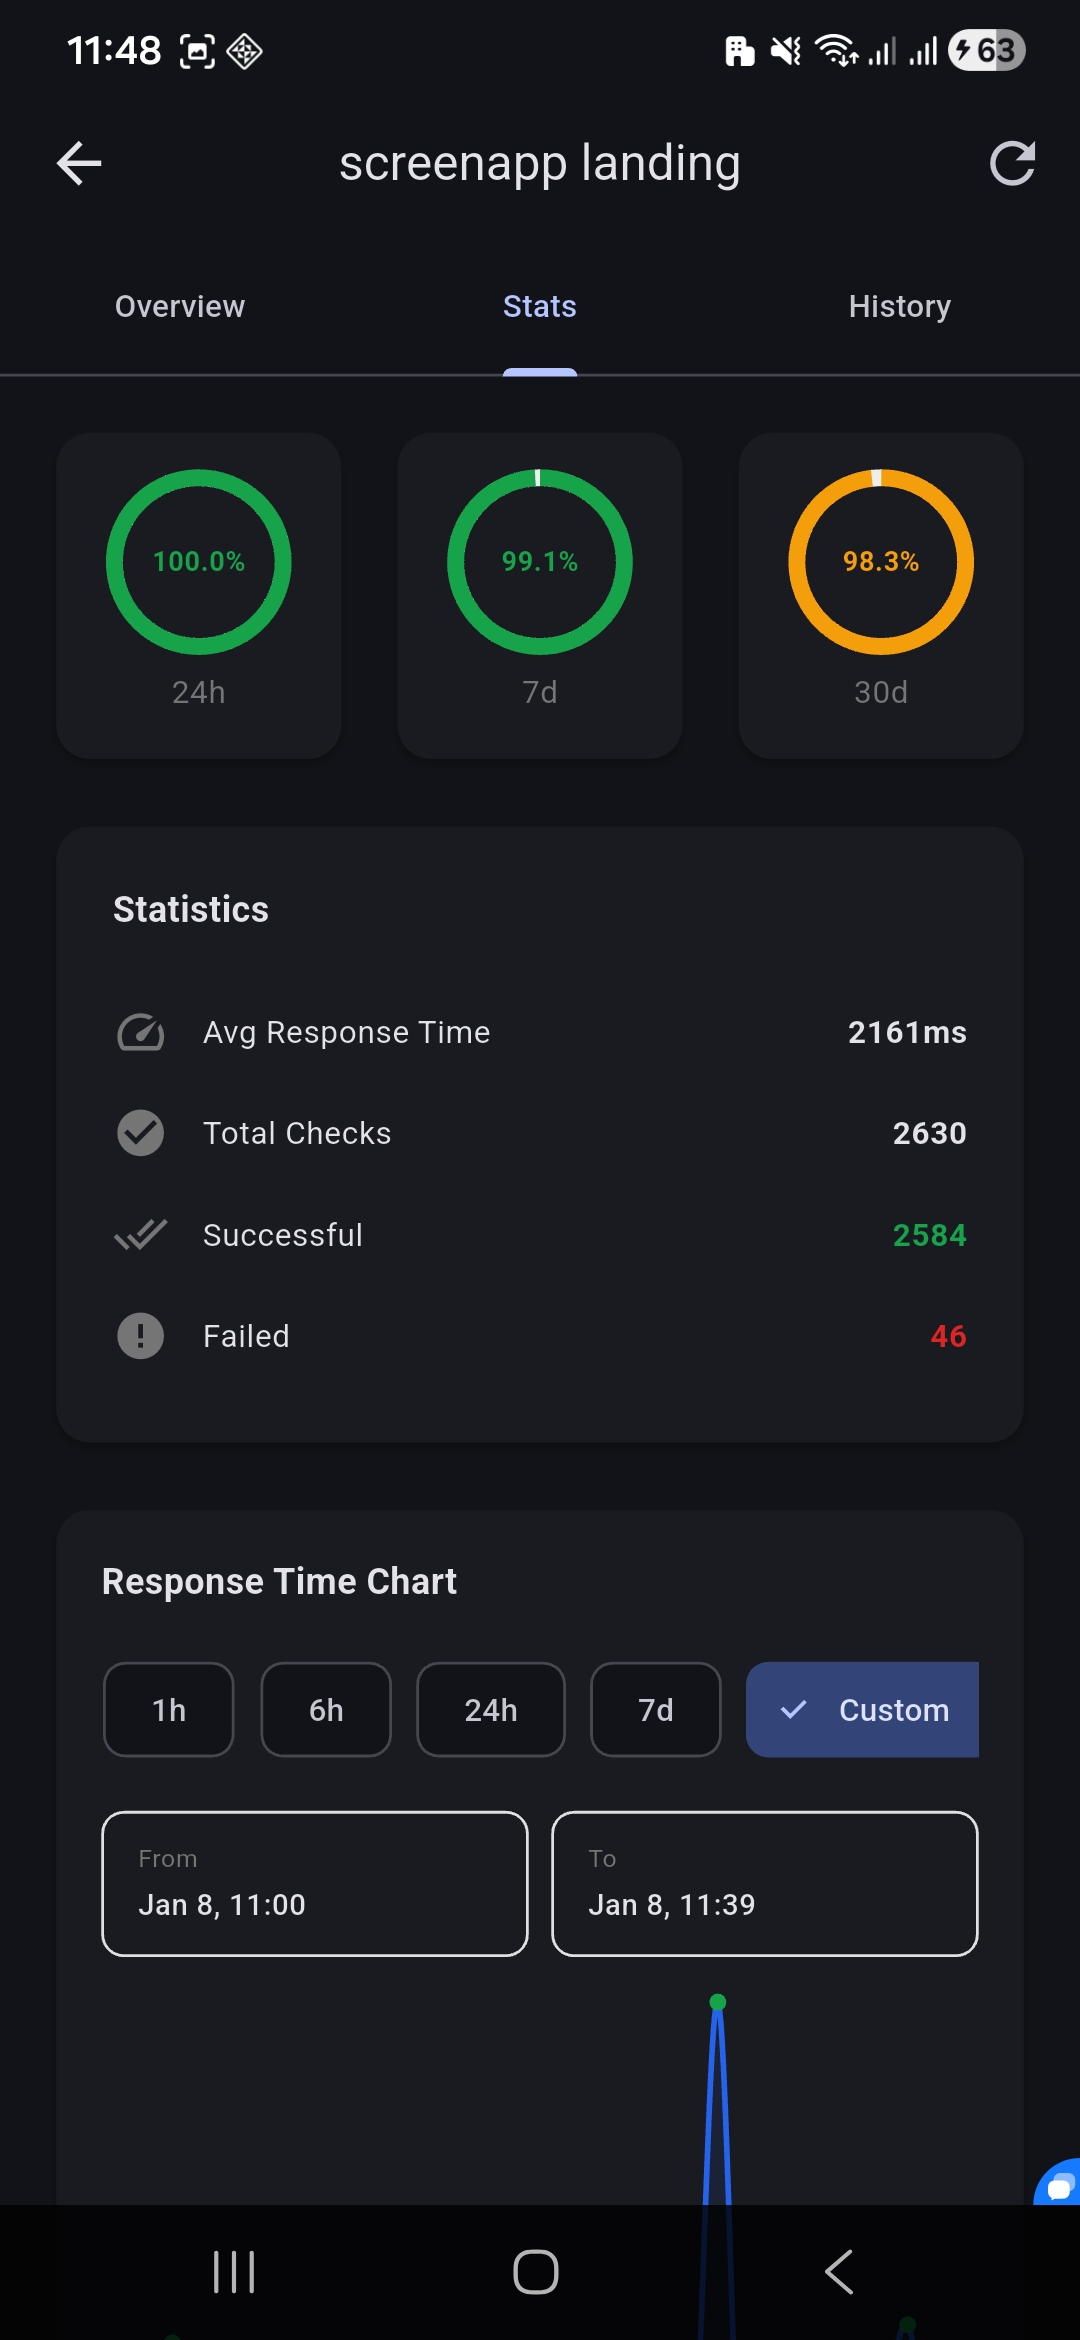
Detailed view of each monitor with response time charts and flexible time range controls.
Monitor your services on the go with the native mobile app. Google Play | App Store
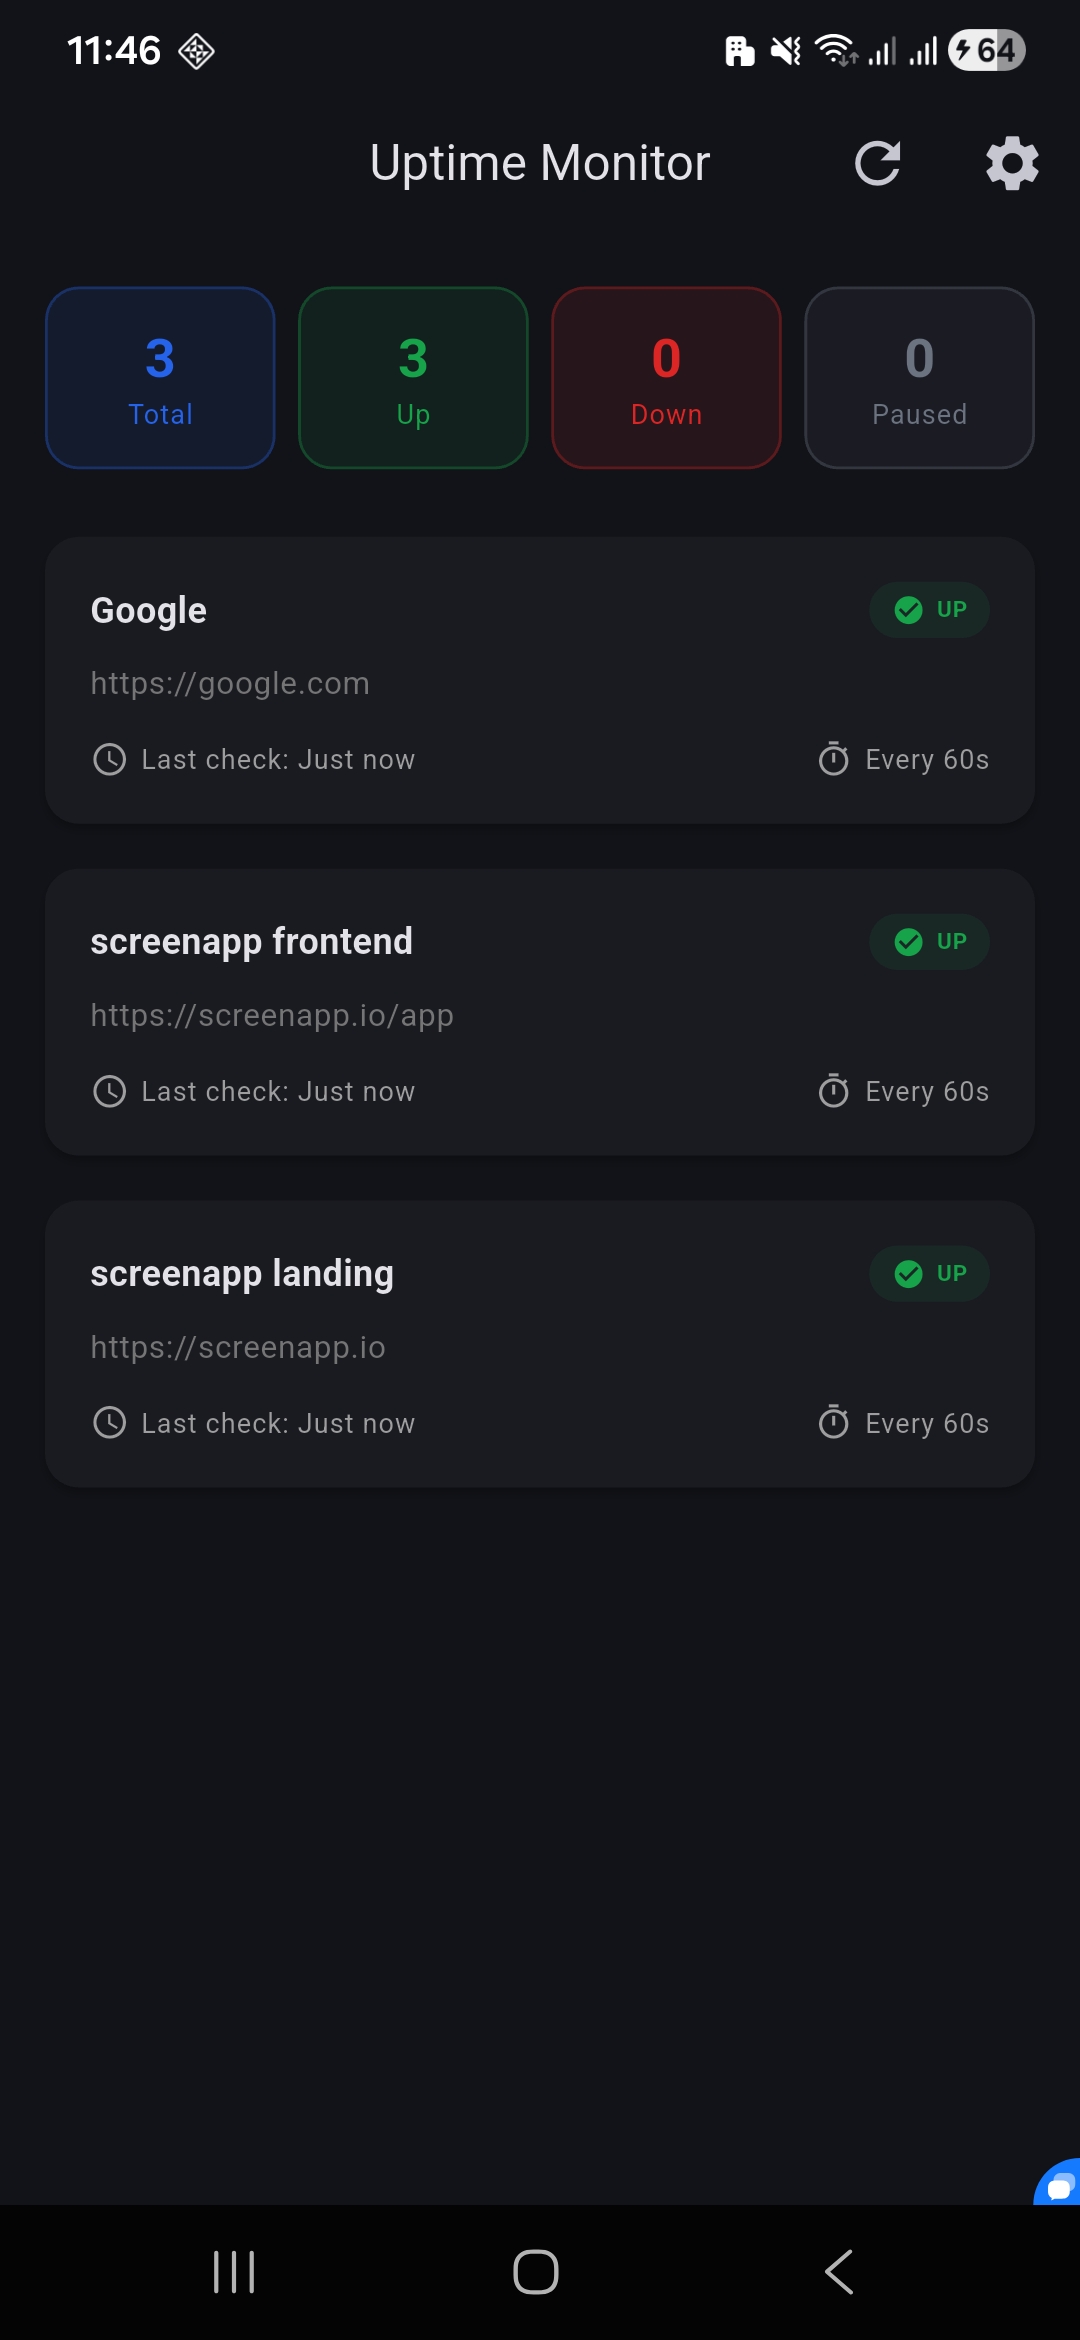
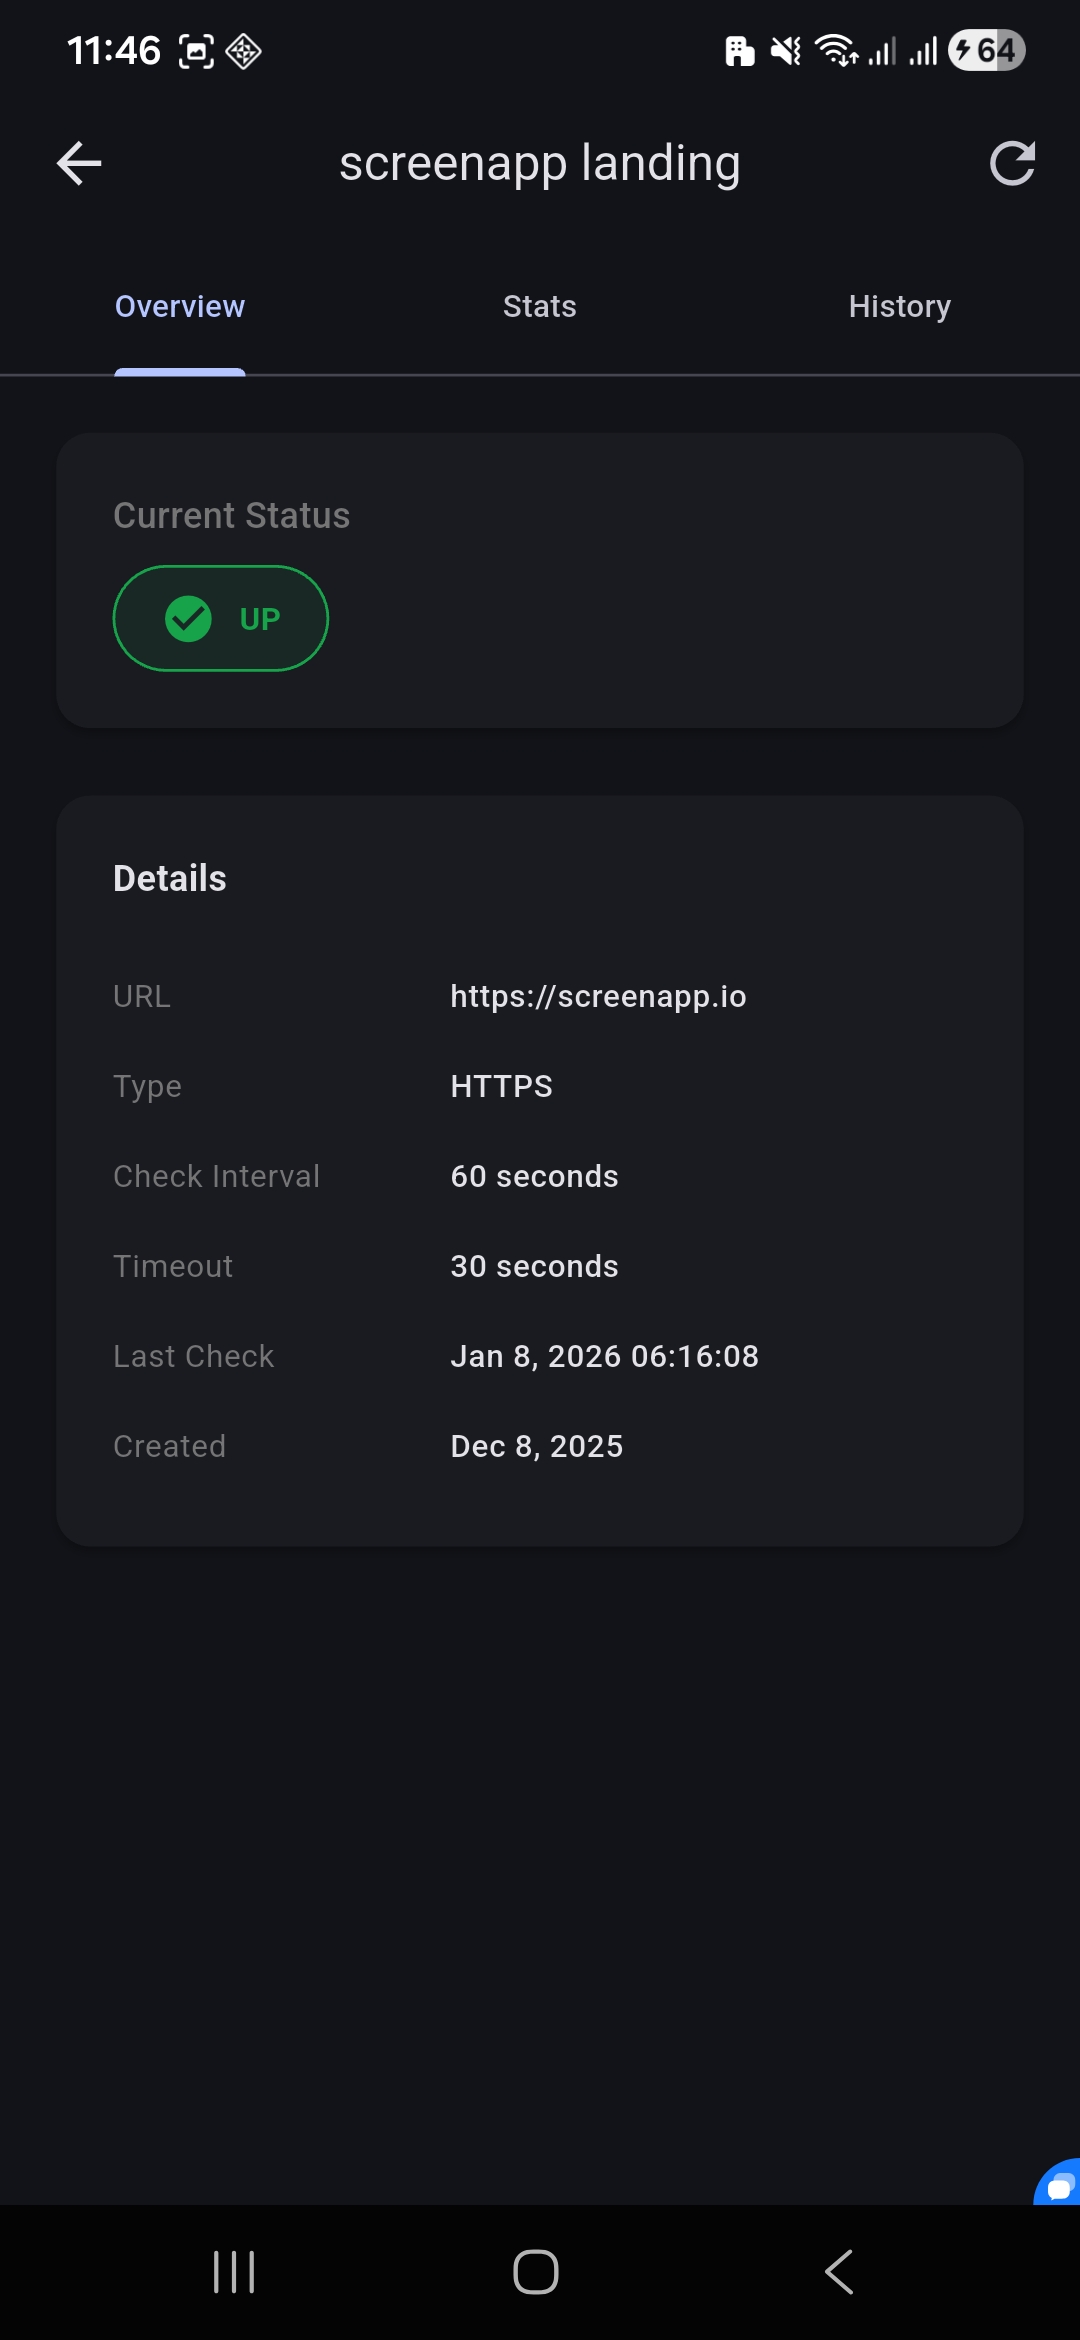
Features:
- Real-time monitor status at a glance
- Push notifications for downtime alerts
- Detailed uptime statistics (24h, 7d, 30d)
- Interactive response time charts
- Monitor configuration and management
- Frontend: Next.js 15, React, TypeScript, Tailwind CSS
- Backend: Next.js API Routes, Node.js
- Database: MongoDB with Mongoose ODM
- Authentication: NextAuth.js with credentials provider
- UI Components: shadcn/ui
- Charts: Recharts
- Email: Nodemailer
- Alerts: Nodemailer (email), Twilio (phone), Webhooks
- Monitoring: API-based cron architecture
The easiest way to get started - one command starts everything!
Prerequisites: Docker and Docker Compose installed
1. Clone and configure:
git clone https://github.com/screenappai/uptime-monitor.git
cd uptime-monitor
cp .env.example .env
# Edit .env with your credentials
2. Start everything:
docker compose upThat's it! 🎉 This single command starts:
- ✅ MongoDB database
- ✅ Next.js application with hot reload
- ✅ Background monitoring service
- ✅ Mailpit (local email testing)
Access:
- App: http://localhost:3200
- Mailpit (view emails): http://localhost:8027
Why Docker Compose?
- 📦 No need to install MongoDB separately
- 🔄 Everything in sync - one command to rule them all
- 🧹 Clean environment - no conflicts with other projects
- 🚀 Same setup for all developers
If you prefer to run without Docker:
Prerequisites:
- Node.js 18+ and npm
- MongoDB instance (local or cloud like MongoDB Atlas)
- SMTP server credentials (for email alerts)
Steps:
- Clone the repository:
git clone https://github.com/screenappai/uptime-monitor.git
cd uptime-monitor- Install dependencies:
npm install- Create a
.envfile:
cp .env.example .env- Configure your environment variables in
.env:
# MongoDB Configuration
MONGODB_URI=mongodb://localhost:27017/uptime-monitor

# Application URL
NEXT_PUBLIC_APP_URL=http://localhost:3200

# Authentication Configuration
NEXTAUTH_URL=http://localhost:3200
NEXTAUTH_SECRET=your-random-secret-key-here-change-this-in-production

# Multi-Tenant Mode
# false = Single-tenant: Only invited users can join (default, recommended for private deployments)
# true = Multi-tenant: Each user can create their own organization (for SaaS)
MULTI_TENANT=false

# Email Configuration (for OTP authentication and alerts)
EMAIL_HOST=smtp.gmail.com
EMAIL_PORT=587
EMAIL_USER=your-email@gmail.com
EMAIL_PASSWORD=your-app-password
EMAIL_FROM=noreply@uptimemonitor.com

# Twilio Configuration (optional - for phone call alerts)
TWILIO_ACCOUNT_SID=your-twilio-account-sid
TWILIO_AUTH_TOKEN=your-twilio-auth-token
TWILIO_PHONE_NUMBER=+1234567890

# Monitoring Configuration
RETRY_COUNT=1
MONITOR_BATCH_SIZE=10- Start the development server:
npm run dev-
Open http://localhost:3200 in your browser
-
Monitoring in Manual Setup:
For manual installation, you have two options:
Option A: Use Docker for monitoring only (Recommended)
# Start just the monitor service
docker compose up monitor
Option B: Set up external cron Create a cron job that calls your API endpoint:
# Example: Add to crontab (Linux/Mac)
* * * * * curl -X GET http://localhost:3200/api/cron/monitor -H "Authorization: Bearer YOUR_CRON_SECRET"
Note: All monitoring logic runs through the /api/cron/monitor API endpoint
The application uses passwordless OTP (One-Time Password) authentication via email for both web and mobile access.
Multi-Tenant Mode:
# Single-tenant mode (default) - Only first user creates org, others need invitation
MULTI_TENANT=false

# Multi-tenant mode - Each user can create their own organization
MULTI_TENANT=true
Single-Tenant Mode (Default - MULTI_TENANT=false):
- ✅ First User: Creates organization (becomes owner with 100 monitors, 20 contact lists, 50 members)
- ✅ Invited Users: Join existing organization as admin/member
- ❌ Uninvited Users: Receive "You are not invited" error
- 🔒 Perfect for private/internal deployments where owner controls access
Multi-Tenant Mode (MULTI_TENANT=true):
- ✅ Anyone can create their own isolated organization
- ✅ First organization gets generous limits (100 monitors)
- ✅ Subsequent organizations get standard limits (5 monitors)
- 🌐 Ideal for SaaS deployments with multiple teams/clients
-
Start the application and navigate to
http://localhost:3200 -
First User Registration:
- Enter your email
- Receive 6-digit OTP code via email
- Enter your name
- Enter your organization name
- You become the owner with full access
-
Invite Team Members (Optional):
- Go to Dashboard → Team
- Send invitations via email
- Invited users complete OTP registration and join your organization
Configure SMTP settings in .env for OTP delivery:
# For local development with Mailpit (Docker Compose):
EMAIL_HOST=mailpit
EMAIL_PORT=1025
EMAIL_FROM=noreply@localhost

# For production (Gmail example):
EMAIL_HOST=smtp.gmail.com
EMAIL_PORT=587
EMAIL_USER=your-email@gmail.com
EMAIL_PASSWORD=your-app-password
EMAIL_FROM=noreply@yourapp.com
Gmail Setup:
- Enable 2-factor authentication in Google Account
- Generate App Password: Google App Passwords
- Use App Password as
EMAIL_PASSWORD
- Navigate to
http://localhost:3200/login - Enter your email address
- Check your email for the 6-digit OTP code
- Enter the OTP code (valid for 10 minutes)
- For new users: Complete registration with name and organization
- You're logged in! Sessions last 30 days (web) or until you logout
/dashboard/*- All dashboard pages (requires authentication)/api/monitors/*- Monitor management APIs (requires authentication)/api/organization/*- Organization & team management (requires authentication)/api/contact-lists/*- Contact list management (requires authentication)
/- Landing page (public)/login- Login page (public)/status/[slug]- Public status pages (public)/api/status-pages/[slug]- Status page API for public viewing (GET only, public)
- ✅ Passwordless authentication (no password storage/leaks)
- ✅ OTP rate limiting (max 3 requests per 10 minutes)
- ✅ OTP expires in 10 minutes
- ✅ Max 5 OTP verification attempts
- ✅ 30-day JWT sessions with secure tokens
- ✅ Organization-based data isolation
- ✅ Role-based access control (owner, admin, member)
If you're upgrading from the old single-tenant version with existing data:
# Set admin email in .env
ADMIN_EMAIL=admin@example.com

# Run migration script
npm run migrate
This creates a default organization and assigns all existing monitors to it.
The mobile app supports push notifications for monitor alerts. You have three options:
Use the shared community FCM relay service. Add to .env:
FCM_RELAY_URL=https://us-central1-uptime-monitor-483415.cloudfunctions.net/sendNotification
FCM_RELAY_API_KEY=uptime-monitor-community-2026
Pros:
- ✅ Zero configuration - works immediately
- ✅ No Firebase account needed
- ✅ Free community service
Cons:
⚠️ Shared infrastructure (rate limits apply)⚠️ Community service availability dependent on project maintainer
Use your own Firebase project for full control.
Steps to generate FIREBASE_SERVICE_ACCOUNT:
-
Create Firebase Project:
- Go to https://console.firebase.google.com
- Click "Add project" and follow the wizard
-
Generate Service Account Key:
- In Firebase Console, go to Project Settings (gear icon) → Service accounts
- Click "Generate new private key"
- Click "Generate key" - a JSON file will download
-
Configure Environment Variable:
Open the downloaded JSON file and copy its entire contents. Add to
.env:FIREBASE_SERVICE_ACCOUNT='{"type":"service_account","project_id":"your-project-id","private_key_id":"...","private_key":"-----BEGIN PRIVATE KEY-----\n...\n-----END PRIVATE KEY-----\n","client_email":"...","client_id":"...","auth_uri":"...","token_uri":"...","auth_provider_x509_cert_url":"...","client_x509_cert_url":"..."}'
Important: Wrap the entire JSON in single quotes and keep it on one line.
-
Build Custom Mobile App:
- You'll need to build your own version of the mobile app
- Add your
google-services.jsonto the Flutter project - See mobile/README.md for details
Pros:
- ✅ Full control over infrastructure
- ✅ No rate limit concerns
- ✅ Better for high-volume deployments
Cons:
⚠️ Requires Firebase account⚠️ Requires building custom mobile app⚠️ More complex setup
Deploy your own FCM relay service. See relay/README.md for setup instructions.
Don't configure any FCM settings - push notifications will be disabled.
- Navigate to the dashboard at
http://localhost:3200/dashboard - Click "Add Monitor"
- Fill in the monitor details:
- Name: A friendly name for your monitor
- URL: The endpoint to monitor
- Type: HTTP or HTTPS
- Interval: How often to check (minimum 30 seconds)
- Timeout: Maximum time to wait for a response
- Alert Emails: Comma-separated list of email addresses
- Phone Numbers: Comma-separated list of phone numbers (with country code, e.g., +1234567890)
- Webhook URLs: Comma-separated list of webhook URLs
- Create a status page via API:
curl -X POST http://localhost:3200/api/status-pages \
  -H "Content-Type: application/json" \
  -d '{
    "slug": "my-services",
    "title": "My Services Status",
    "description": "Current status of all our services",
    "monitors": ["monitor-id-1", "monitor-id-2"],
    "branding": {
      "primaryColor": "#3b82f6"
    }
}'- Access your status page at
http://localhost:3200/status/my-services
GET /api/monitors- List all monitorsPOST /api/monitors- Create a new monitorGET /api/monitors/:id- Get a specific monitorPUT /api/monitors/:id- Update a monitorDELETE /api/monitors/:id- Delete a monitorGET /api/monitors/:id/checks- Get check historyGET /api/monitors/:id/stats- Get uptime statisticsPOST /api/monitors/:id/check- Trigger manual check
GET /api/status-pages- List all status pagesPOST /api/status-pages- Create a new status pageGET /api/status-pages/:slug- Get a status page with monitor data
For Gmail:
- Enable 2-factor authentication
- Create an App Password at https://myaccount.google.com/apppasswords
- Use the app password in
EMAIL_PASSWORD
For other providers, use their SMTP settings.
This application supports automated phone call alerts via Twilio when monitors go down.
-
Create a Twilio Account:
- Sign up at https://www.twilio.com
- Get your Account SID and Auth Token from the console
-
Get a Phone Number:
- Purchase a phone number from Twilio (or use a trial number for testing)
- Trial accounts can only call verified numbers
-
Configure Environment Variables:
TWILIO_ACCOUNT_SID=your-account-sid-here
TWILIO_AUTH_TOKEN=your-auth-token-here
TWILIO_PHONE_NUMBER=+1234567890- Add Phone Numbers to Monitors:
- In the monitor form, add phone numbers in the "Phone Numbers" field
- Use E.164 format:
+[country code][number] - Example:
+12125551234 - Multiple numbers: separate with commas
When a monitor detects downtime:
- The system initiates an automated call to configured phone numbers
- Recipients hear a voice message with the monitor name and URL
- Calls are made using Twilio's voice API with TwiML
Note: Twilio charges apply per call. Check pricing at https://www.twilio.com/voice/pricing
Docker Compose makes deployment consistent across development, staging, and production.
For local development with live code reloading:
1. Create a .env file in the project root:
# Copy from .env.example and fill in your values
NEXTAUTH_SECRET=your-secret-here
ADMIN_USERNAME=admin
ADMIN_PASSWORD=your-password

EMAIL_HOST=smtp.gmail.com
EMAIL_PORT=587
EMAIL_USER=your-email@gmail.com
EMAIL_PASSWORD=your-app-password
EMAIL_FROM=noreply@uptimemonitor.com

# Optional: Twilio for phone alerts
TWILIO_ACCOUNT_SID=your-account-sid
TWILIO_AUTH_TOKEN=your-auth-token
TWILIO_PHONE_NUMBER=+1234567890
2. Start development environment:
docker compose upFeatures:
- ✅ Hot reload - code changes reflect immediately
- ✅ Volume mounting - edit files on your machine
- ✅ Fast iteration - no rebuild needed
- ✅ Full stack - MongoDB + App + Cron service
- ✅ API-based monitoring - cron service calls
/api/cron/monitorendpoint
3. Access:
- Web UI: http://localhost:3200
- MongoDB: localhost:27017
4. Stop:
docker compose downBoth deployment options use the same API-based cron architecture:
- 🔄 Monitor Service: Lightweight curl container (only ~32MB RAM!)
- 📡 How it works: Calls
/api/cron/monitorAPI endpoint every minute - ✅ Benefits: Simple, consistent, easy to debug
Choose your deployment option based on your infrastructure:
Best for: Single-server deployments, full control, isolated environments
1. Setup environment:
cp .env.example .env
# Edit .env with your production settings
Important: Set these URLs to your production domain in .env:
NEXT_PUBLIC_APP_URL=https://monitor.yourdomain.com
NEXTAUTH_URL=https://monitor.yourdomain.com
NEXTAUTH_SECRET=your-secret-here
ADMIN_USERNAME=admin
ADMIN_PASSWORD=your-secure-password
# ... other credentials
2. Deploy:
# Pull latest image and start all services
docker pull ghcr.io/screenappai/uptime-monitor:latest
docker compose -f docker-compose.selfhosted.yml up -d
What's included:
- MongoDB database (persistent storage)
- Next.js app (pre-built from GHCR)
- Monitor service (curl-based cron)
Requirements:
- 1GB+ RAM recommended
- Docker & Docker Compose
Best for: Small VPS (t3a.nano), cost optimization, managed database
1. Setup environment:
cp .env.example .env
# Edit .env with your MongoDB Atlas connection string
2. Deploy:
docker pull ghcr.io/screenappai/uptime-monitor:latest
docker compose -f docker-compose.managed.yml up -d
What's included:
- Next.js app (pre-built from GHCR)
- Monitor service (curl-based cron)
Requirements:
- 512MB+ RAM (works on t3a.nano!)
- MongoDB Atlas account (free tier available)
- Docker & Docker Compose
Environment Variables Required:
# .env file
MONGODB_URI=mongodb+srv://user:pass@cluster.mongodb.net/uptime-monitor
CRON_SECRET=your-random-secret  # Optional but recommended
# ... other vars (EMAIL_*, TWILIO_*, etc.)Deploy to Vercel with built-in cron jobs for automated monitoring. Perfect for low to medium traffic sites.
Prerequisites:
- Vercel account (free tier available)
- MongoDB Atlas account (free tier available)
Deployment Steps:
1. Prepare your repository:
# Make sure vercel.json exists (already included in the repo)
# It configures cron to run every minute
2. Set up MongoDB Atlas:
- Sign up at https://www.mongodb.com/cloud/atlas/register
- Create a free cluster (512 MB shared)
- Get your connection string (e.g.,
mongodb+srv://user:pass@cluster.mongodb.net/uptime-monitor)
3. Deploy to Vercel:
Option A: Using Vercel CLI (Recommended)
# Install Vercel CLI
npm i -g vercel

# Login to Vercel
vercel login

# Deploy
vercel

# Set environment variables
vercel env add MONGODB_URI
vercel env add NEXTAUTH_SECRET
vercel env add CRON_SECRET
vercel env add ADMIN_USERNAME
vercel env add ADMIN_PASSWORD
# Add other env vars as needed (EMAIL_*, TWILIO_*)

# Deploy to production
vercel --prod
Option B: Using Vercel Dashboard
- Go to https://vercel.com/new
- Import your GitHub repository
- Configure environment variables in the Vercel dashboard:
MONGODB_URI- Your MongoDB Atlas connection stringNEXTAUTH_URL- Your Vercel domain (e.g.,https://your-app.vercel.app)NEXTAUTH_SECRET- Generate withopenssl rand -base64 32CRON_SECRET- Generate withopenssl rand -base64 32ADMIN_USERNAME- Your admin usernameADMIN_PASSWORD- Your admin password- Add email and Twilio variables as needed
- Click "Deploy"
4. Verify Cron is Running:
After deployment, check:
- Go to your Vercel project → Settings → Cron Jobs
- You should see
/api/cron/monitorscheduled to run every minute - Check the "Logs" tab to see cron executions
Cost: Free tier available, Pro $20/month for production. Limitation: 60s timeout (10s Hobby), 1-min minimum check interval.
Deploy to AWS using Lambda (cron) + Amplify (frontend) for better performance and lower costs.
Why AWS? 15-min timeout, $0-9/month (vs $20/month Vercel Pro), 1M free Lambda requests.
Prerequisites: AWS account, AWS CLI, Node.js 18+
Deploy:
- Install Serverless Framework:
npm install -g serverless- Configure AWS Credentials:
aws configure
# Enter your AWS Access Key ID and Secret Access Key
# Region: us-east-1 (or your preferred region)- Set Environment Variables:
cp .env.lambda.example .env.lambda
# Edit with: NEXT_PUBLIC_APP_URL (your deployed app) and CRON_SECRET
Note: Lambda only needs these 2 variables. All other config lives in your Next.js app.
- Deploy Lambda:
npm install
npm run deploy:lambda
Creates: Lambda function (~1-5 MB), EventBridge cron (1 min), API Gateway endpoints.
- Deploy Frontend: Use AWS Amplify Console - connect Git repo, add env vars, deploy.
Test Deployment:
# Test Lambda function
npm run invoke:cron

# View logs
npm run logs:cron
Useful commands: npm run invoke:cron (test), npm run logs:cron (logs), npm run remove:lambda (cleanup)
Cost Breakdown:
| Component | Free Tier | Typical Cost |
|---|---|---|
| Lambda | 1M requests + 400K GB-seconds | $0-2/month |
| Amplify | 1K build mins + 15 GB transfer | $0-7/month |
| MongoDB Atlas | 512 MB storage | $0/month |
| Total | $0-9/month |
Monitoring:
- Lambda logs: CloudWatch Logs
- Lambda metrics: CloudWatch Metrics
- Amplify builds: Amplify Console
- Set up CloudWatch alarms for errors
This project includes GitHub Actions workflows to automatically build and publish Docker images.
The project is configured to automatically push images to GitHub Container Registry when you push to main or create tags.
Automatic tags created:
latest- Always points to the latest main branch buildmain-<sha>- Tagged with short commit SHA (e.g.,main-a1b2c3d)v1.0.0- Semantic version tags (when you create git tags)v1.0,v1- Major and minor version tags
Pull the image:
# Latest version
docker pull ghcr.io/screenappai/uptime-monitor:latest

# Specific SHA
docker pull ghcr.io/screenappai/uptime-monitor:main-a1b2c3d

# Specific version
docker pull ghcr.io/screenappai/uptime-monitor:v1.0.0
No setup required! GitHub Container Registry works automatically with your repository.
To use Docker Hub instead:
- Rename
.github/workflows/docker-build-dockerhub.yml.exampletodocker-build-dockerhub.yml - Update
IMAGE_NAMEin the file to your Docker Hub username - Add repository secrets:
DOCKERHUB_USERNAME- Your Docker Hub usernameDOCKERHUB_TOKEN- Docker Hub access token
Multi-architecture support:
Both workflows build for linux/amd64 and linux/arm64 (Apple Silicon compatible).
Contributions are welcome! Please follow these steps:
- Fork the repository
- Create a feature branch:
git checkout -b feature/amazing-feature - Commit your changes:
git commit -m 'Add amazing feature' - Push to the branch:
git push origin feature/amazing-feature - Open a Pull Request
- Basic authentication with NextAuth.js
- Docker Compose setup
- Twilio phone call alerts
- Multi-user authentication and role-based access
- More monitor types (TCP, Ping, DNS)
- Custom alert thresholds
- Maintenance windows
- Incident management
- Slack integration
- Discord integration
- Mobile app (Android/iOS with push notifications)
This project is licensed under the MIT License - see the LICENSE file for details.
- Built with Next.js
- UI components from shadcn/ui
- Inspired by UptimeRobot
We're here to help! Connect with us through any of these channels:
- Discord Community: Join our Discord - Our main forum for discussions, support, and real-time collaboration
- GitHub Issues: Report bugs or request features
- GitHub Discussions: Ask questions and share ideas
- Documentation: Check our Wiki for detailed guides
We welcome contributions! Please see our CONTRIBUTING.md file for:
- Development setup
- Code standards
- Pull request process
- Commit message guidelines
If you find this project helpful, please give it a star on GitHub! It helps others discover the project.
| File | Purpose | Required Variables |
|---|---|---|
.env |
Local development (Docker) | All variables (MongoDB, email, Twilio, etc.) |
.env.lambda |
AWS Lambda deployment | NEXT_PUBLIC_APP_URL, CRON_SECRET |
| Amplify/Vercel env | Next.js app production | All variables (MongoDB, email, Twilio, etc.) |
| Endpoint | Method | Purpose | Auth Required |
|---|---|---|---|
/api/cron/monitor |
GET | Run monitor checks (called by cron) | Optional (CRON_SECRET) |
/api/monitors |
GET/POST | List/create monitors | Yes |
/api/monitors/[id] |
GET/PUT/DELETE | Monitor operations | Yes |
/api/monitors/[id]/check |
POST | Manual check | Yes |
/api/status-pages |
GET/POST | List/create status pages | Yes |
/status/[slug] |
GET | Public status page | No |
# Docker development
docker compose up                          # Start all services
docker compose up monitor                  # Start only monitor service

# AWS Lambda (uses .env.lambda)
npm run deploy:lambda                      # Deploy to production (uses dotenv-cli)
npm run invoke:cron                        # Test Lambda function
npm run logs:cron                          # View Lambda logs
npm run remove:lambda                      # Remove all Lambda resources

# Vercel (if using Vercel instead)
vercel                                     # Deploy to preview
vercel --prod # Deploy to production┌─────────────────┐
│ Cron Trigger │ (EventBridge/Vercel Cron/Docker Script)
└────────┬────────┘
│ Calls every minute
▼
┌─────────────────┐
│ Next.js API │ /api/cron/monitor
│ │ - Fetches monitors
│ │ - Checks endpoints
│ │ - Saves results
│ │ - Sends alerts
└────────┬────────┘
│
▼
┌─────────────────┐
│ MongoDB │ Stores monitors & check history
└─────────────────┘
ScreenApp - https://screenapp.io
Project Link: https://github.com/screenappai/uptime-monitor