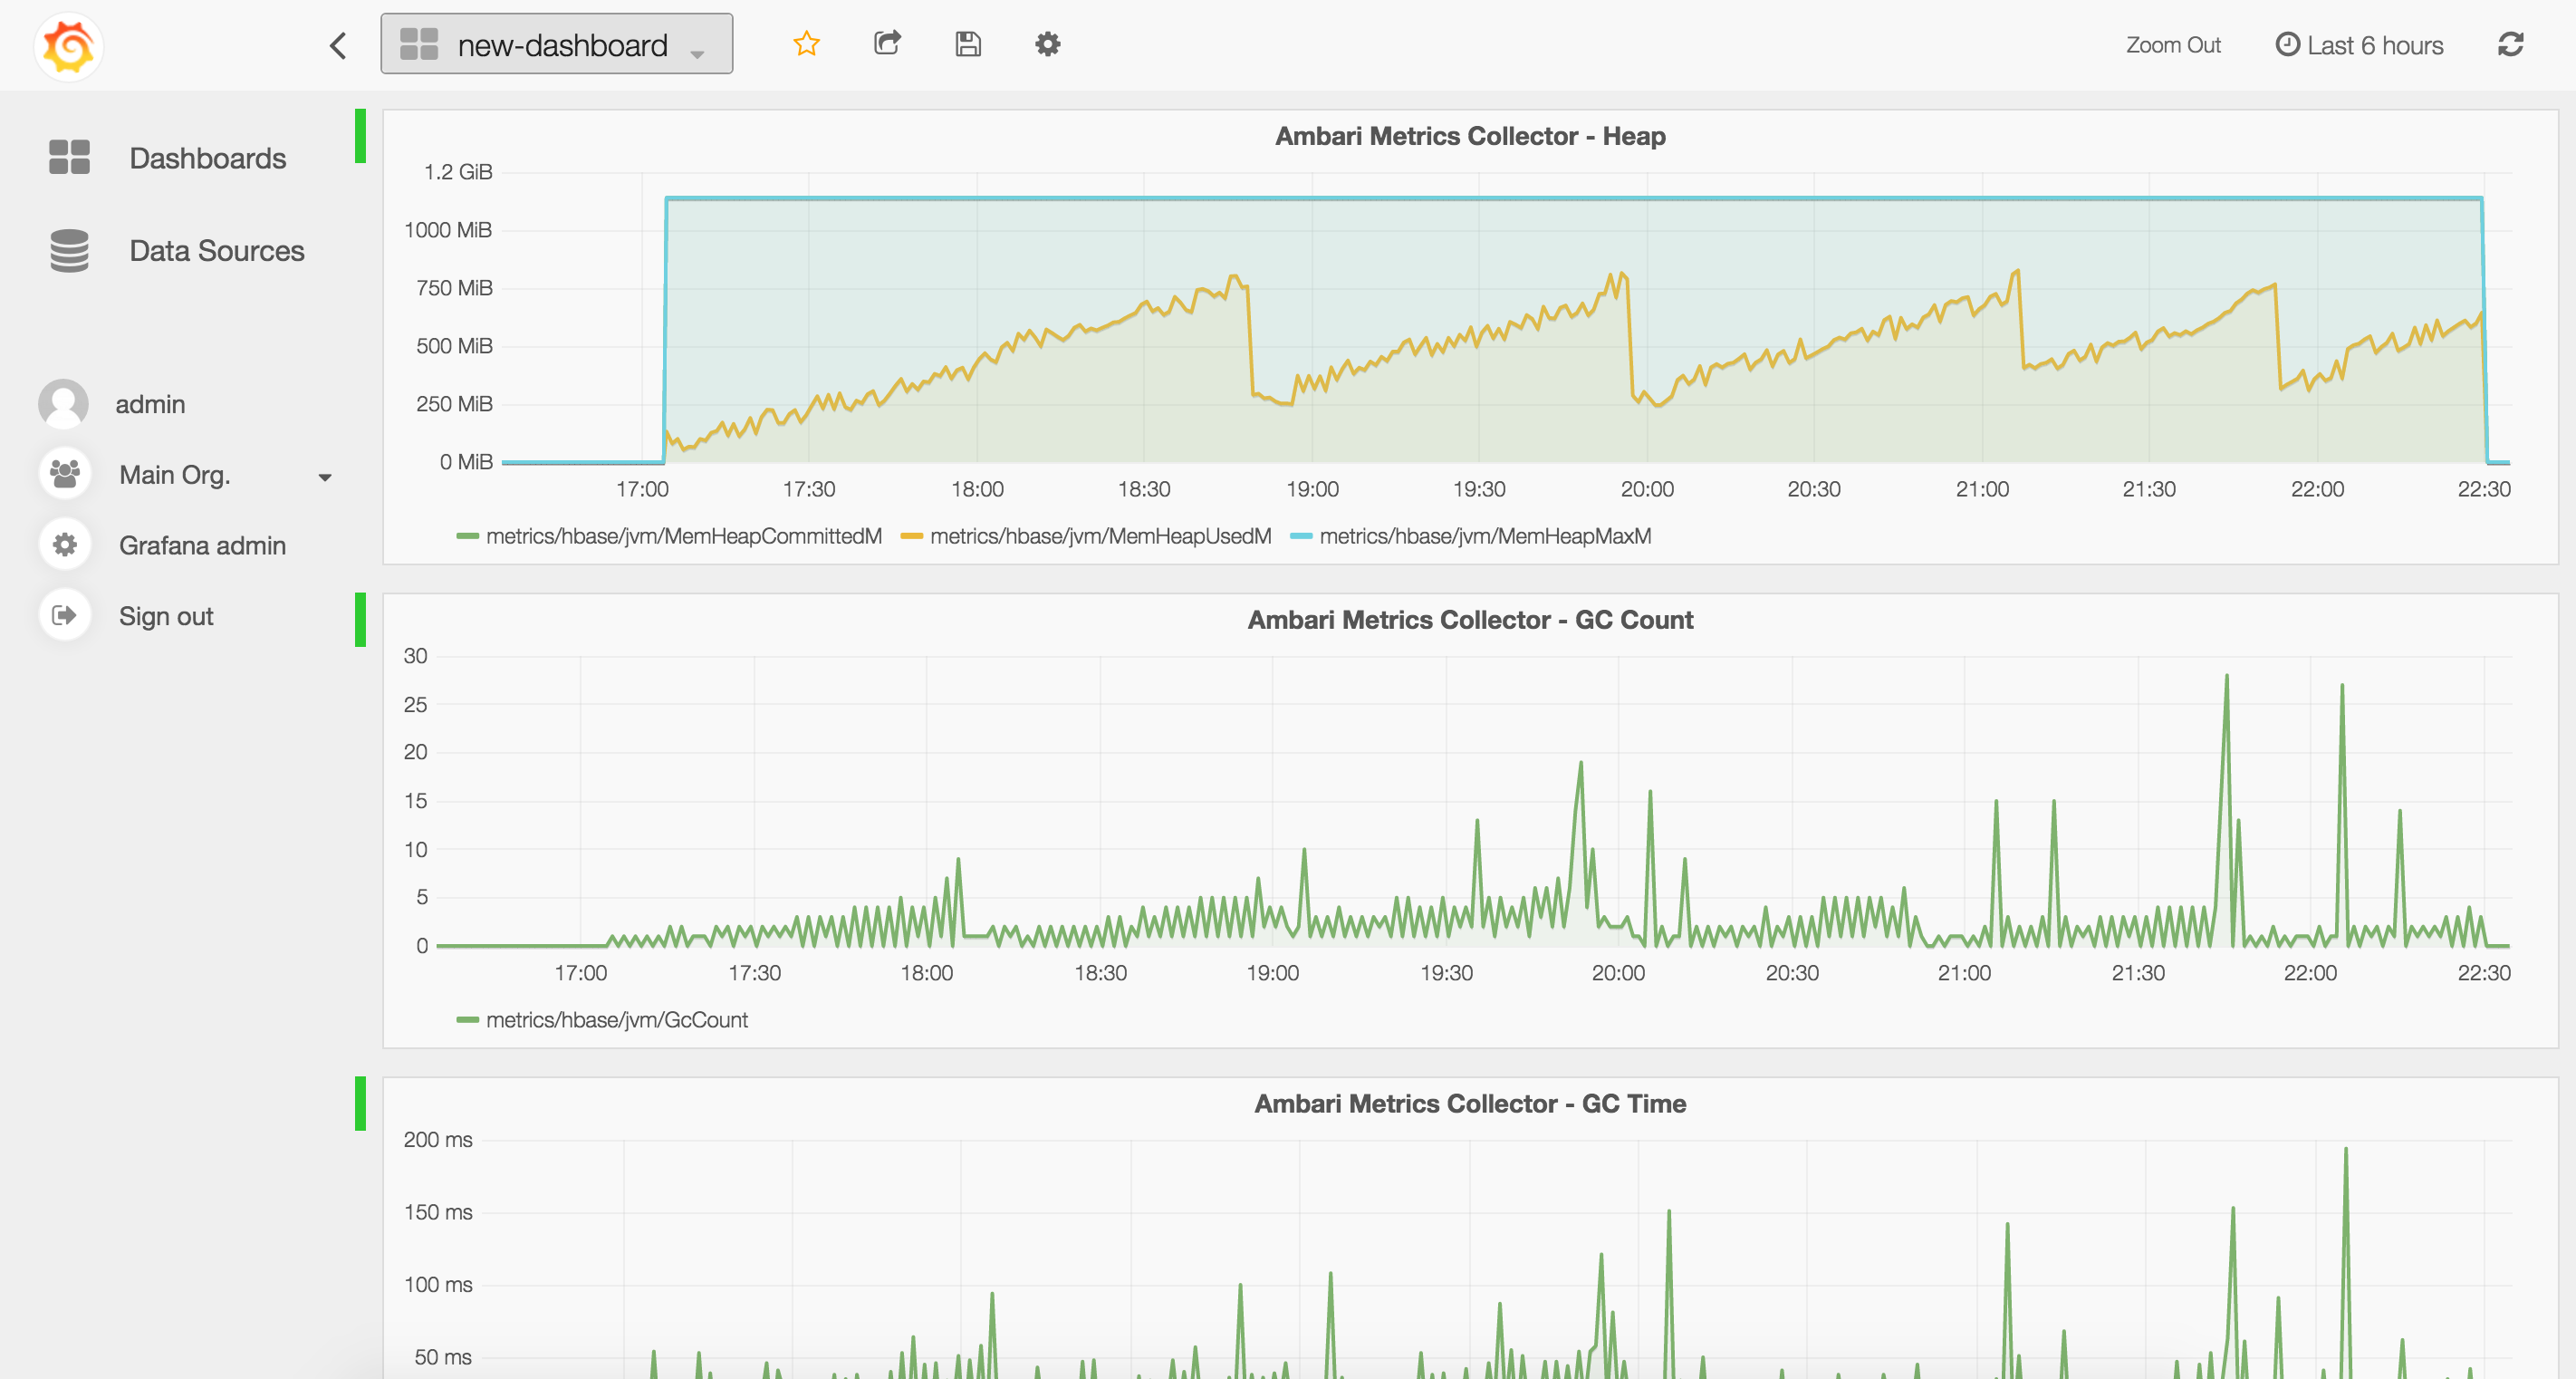
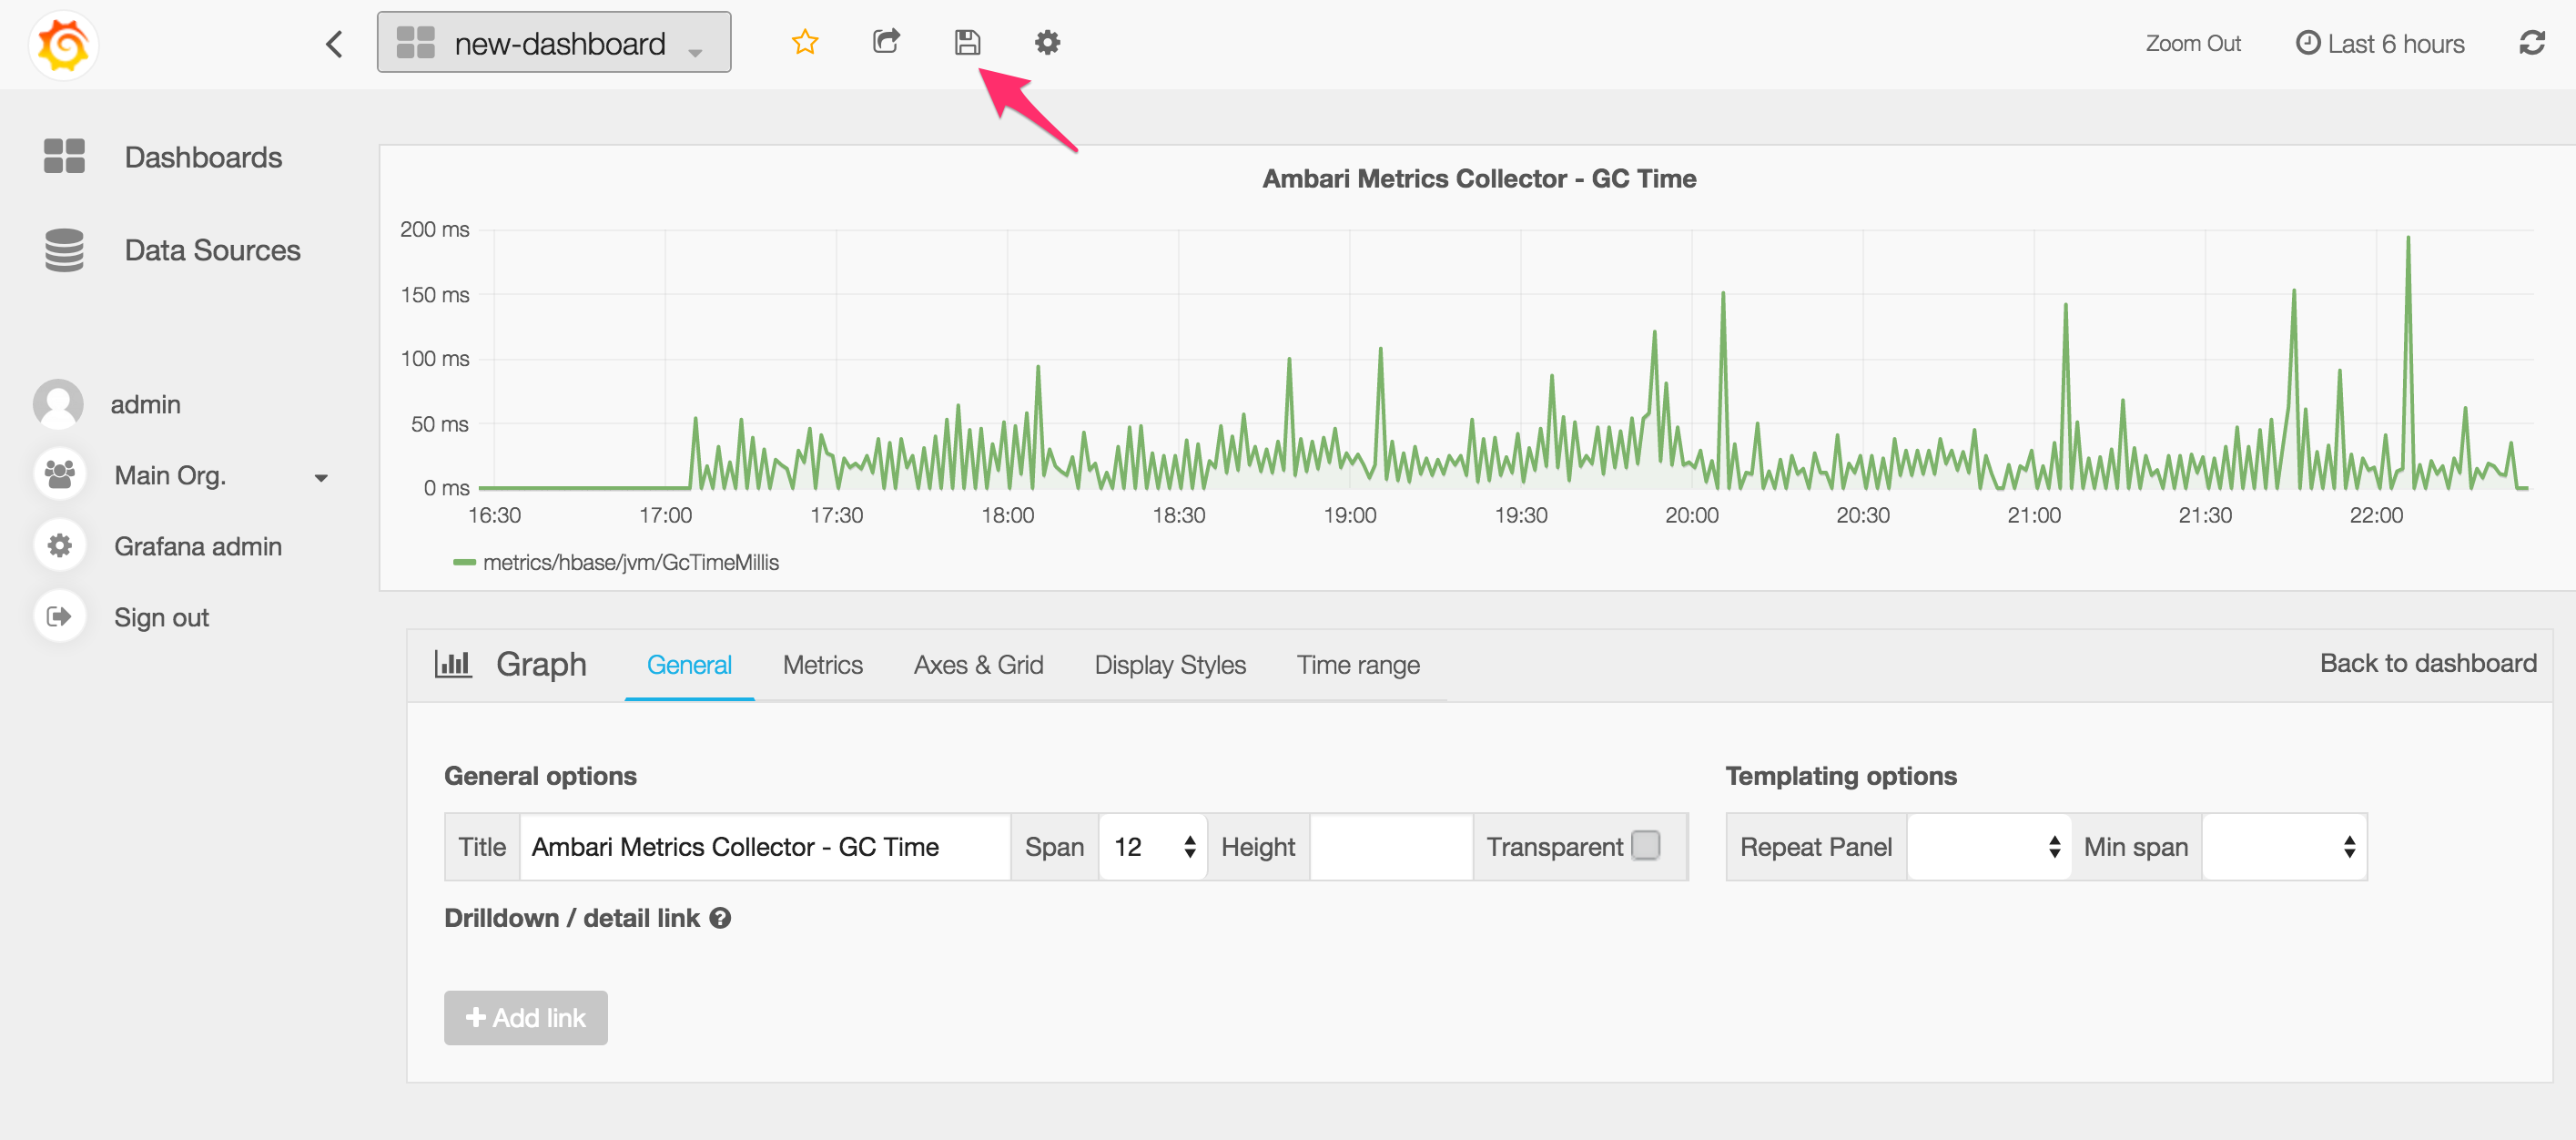
Use ambari-grafana to visualize metrics exposed via Ambari in Grafana. The following service metrics are supported as of now: HDFS, YARN, HBase, Storm, Kafka, Flume, Accumulo, and Ambari Metrics
NOTE: Development of Ambari Grafana plugin has moved to: https://github.com/apache/ambari/tree/trunk/ambari-metrics/ambari-metrics-grafana
This repository is no longer actively maintained.
This has been tested with Ambari 2.1.2/2.2.0 + HDP 2.3.
ambari-grafana is licensed under the Apache License, Version 2.0.
You can install Grafana on any host. It does not need to be co-located with Ambari Server. The only requirement is that it has network access to Ambari Server.
Install on CentOS/Red Hat:
sudo yum install https://grafanarel.s3.amazonaws.com/builds/grafana-2.6.0-1.x86_64.rpm
Install on Ubuntu/Debian:
wget https://grafanarel.s3.amazonaws.com/builds/grafana_2.6.0_amd64.deb
sudo apt-get install -y adduser libfontconfig
sudo dpkg -i grafana_2.6.0_amd64.deb
Install on SUSE/SLES:
sudo rpm -i --nodeps grafana-2.6.0-1.x86_64.rpm
sudo wget https://github.com/u39kun/ambari-grafana/raw/master/dist/ambari-grafana.tgz
sudo tar zxvf ambari-grafana.tgz -C /usr/share/grafana/public/app/plugins/datasource
sudo service grafana-server start
Easy deployement for Docker users:
# create /var/lib/grafana as persistent volume storage
docker run -d -v /var/lib/grafana --name grafana-xxl-storage busybox:latest

# start grafana-xxl
docker run \
  -d \
  -p 3000:3000 \
  --name grafana-xxl \
  --volumes-from grafana-xxl-storage \
  monitoringartist/grafana-xxl
Visit Grafana XXL project for more details.
Access Grafana Web UI at http://grafana-host:3000 and log in as admin / admin.
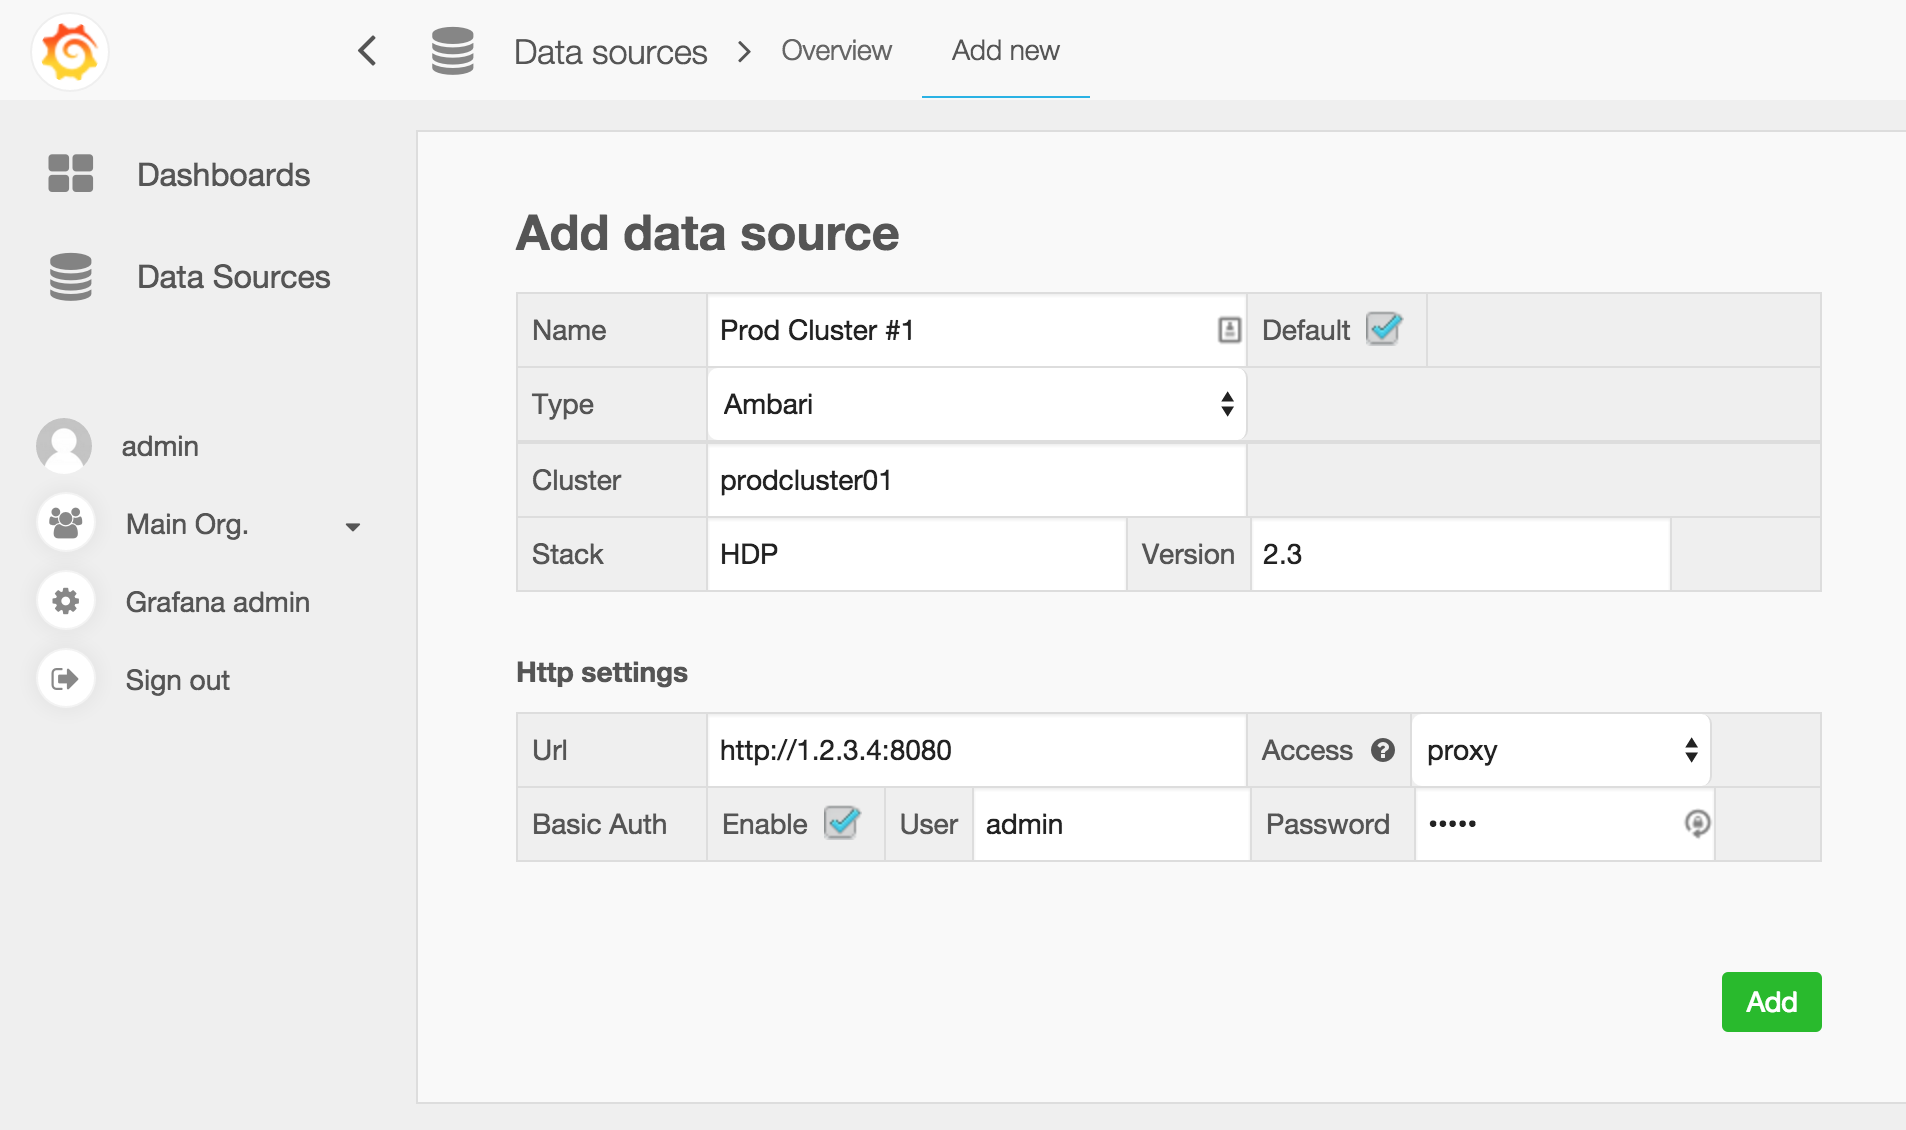
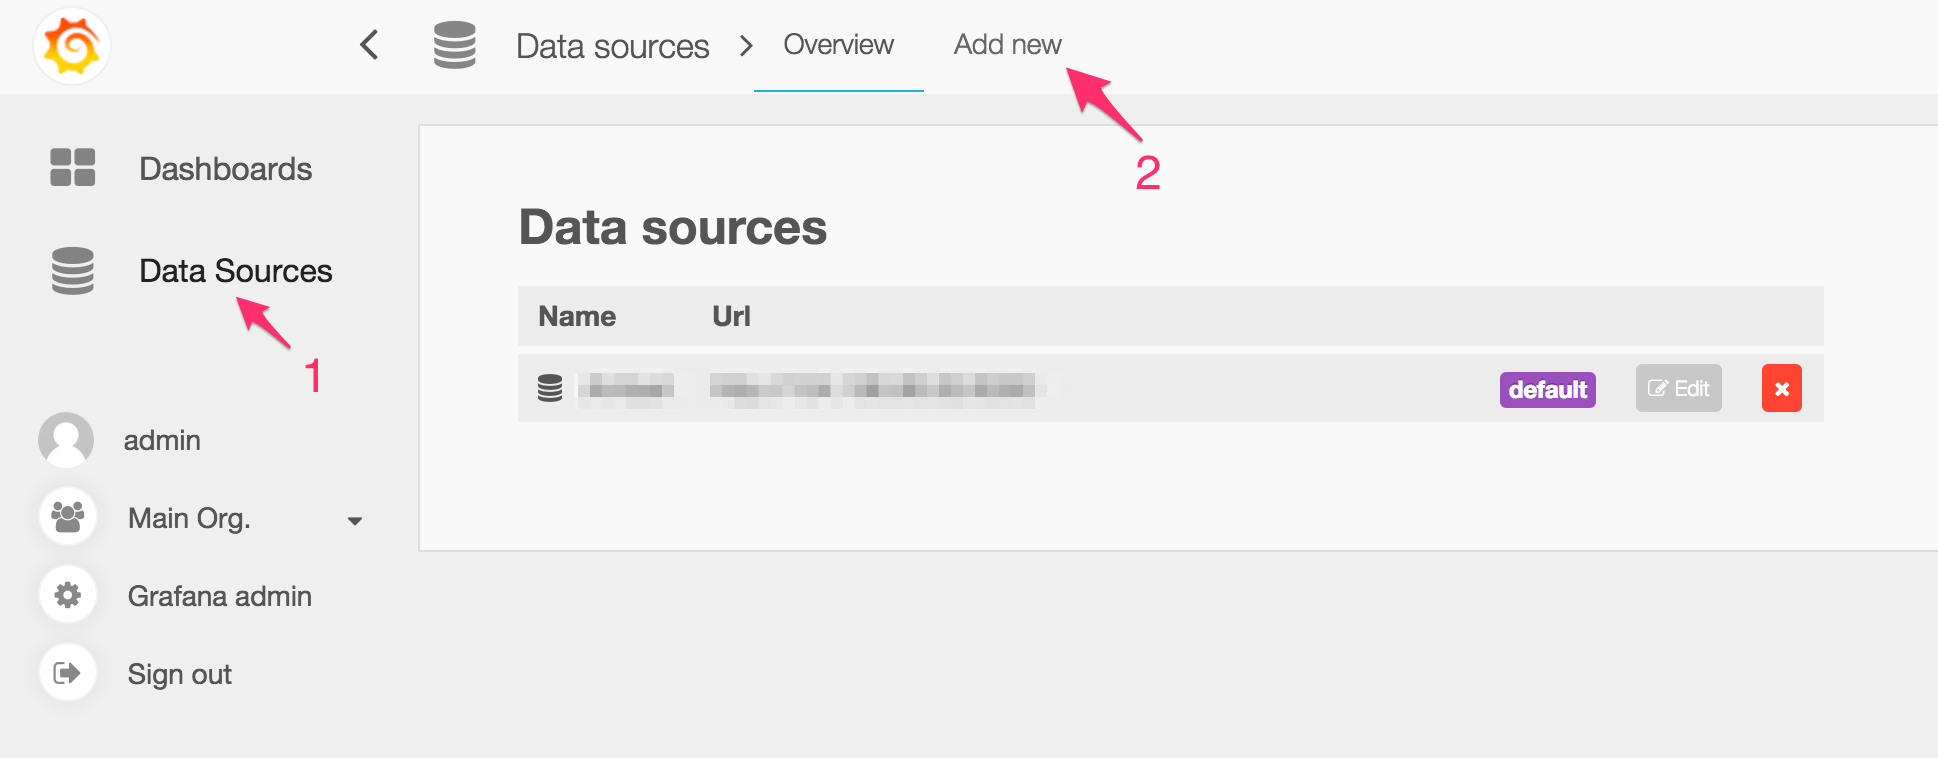
Click on Data Sources in the left nav and click on Add New in the top nav:
- Name: Choose your own data source name
- Default: Recommended to make this the default data source so when you create new graphs, you don't have to select this Ambari Data Source every time
- Type: Ambari
- Cluster: This has to exactly match the cluster name in Ambari
- Stack: HDP (or other stack name that is installed on the cluster)
- Version: 2.3 (or other stack version that is installed on the cluster)
- Url: URL of the Ambari Server, including the port E.g., http://1.2.3.4:8080
- Access: proxy
- Basic Auth: Enable
- User: admin (or the name of any Ambari user that has read access to the cluster)
- Password: password of the Ambari user above
Note: You can set up multiple Ambari Data Sources if you wish to visualize multiple Ambari-managed clusters.
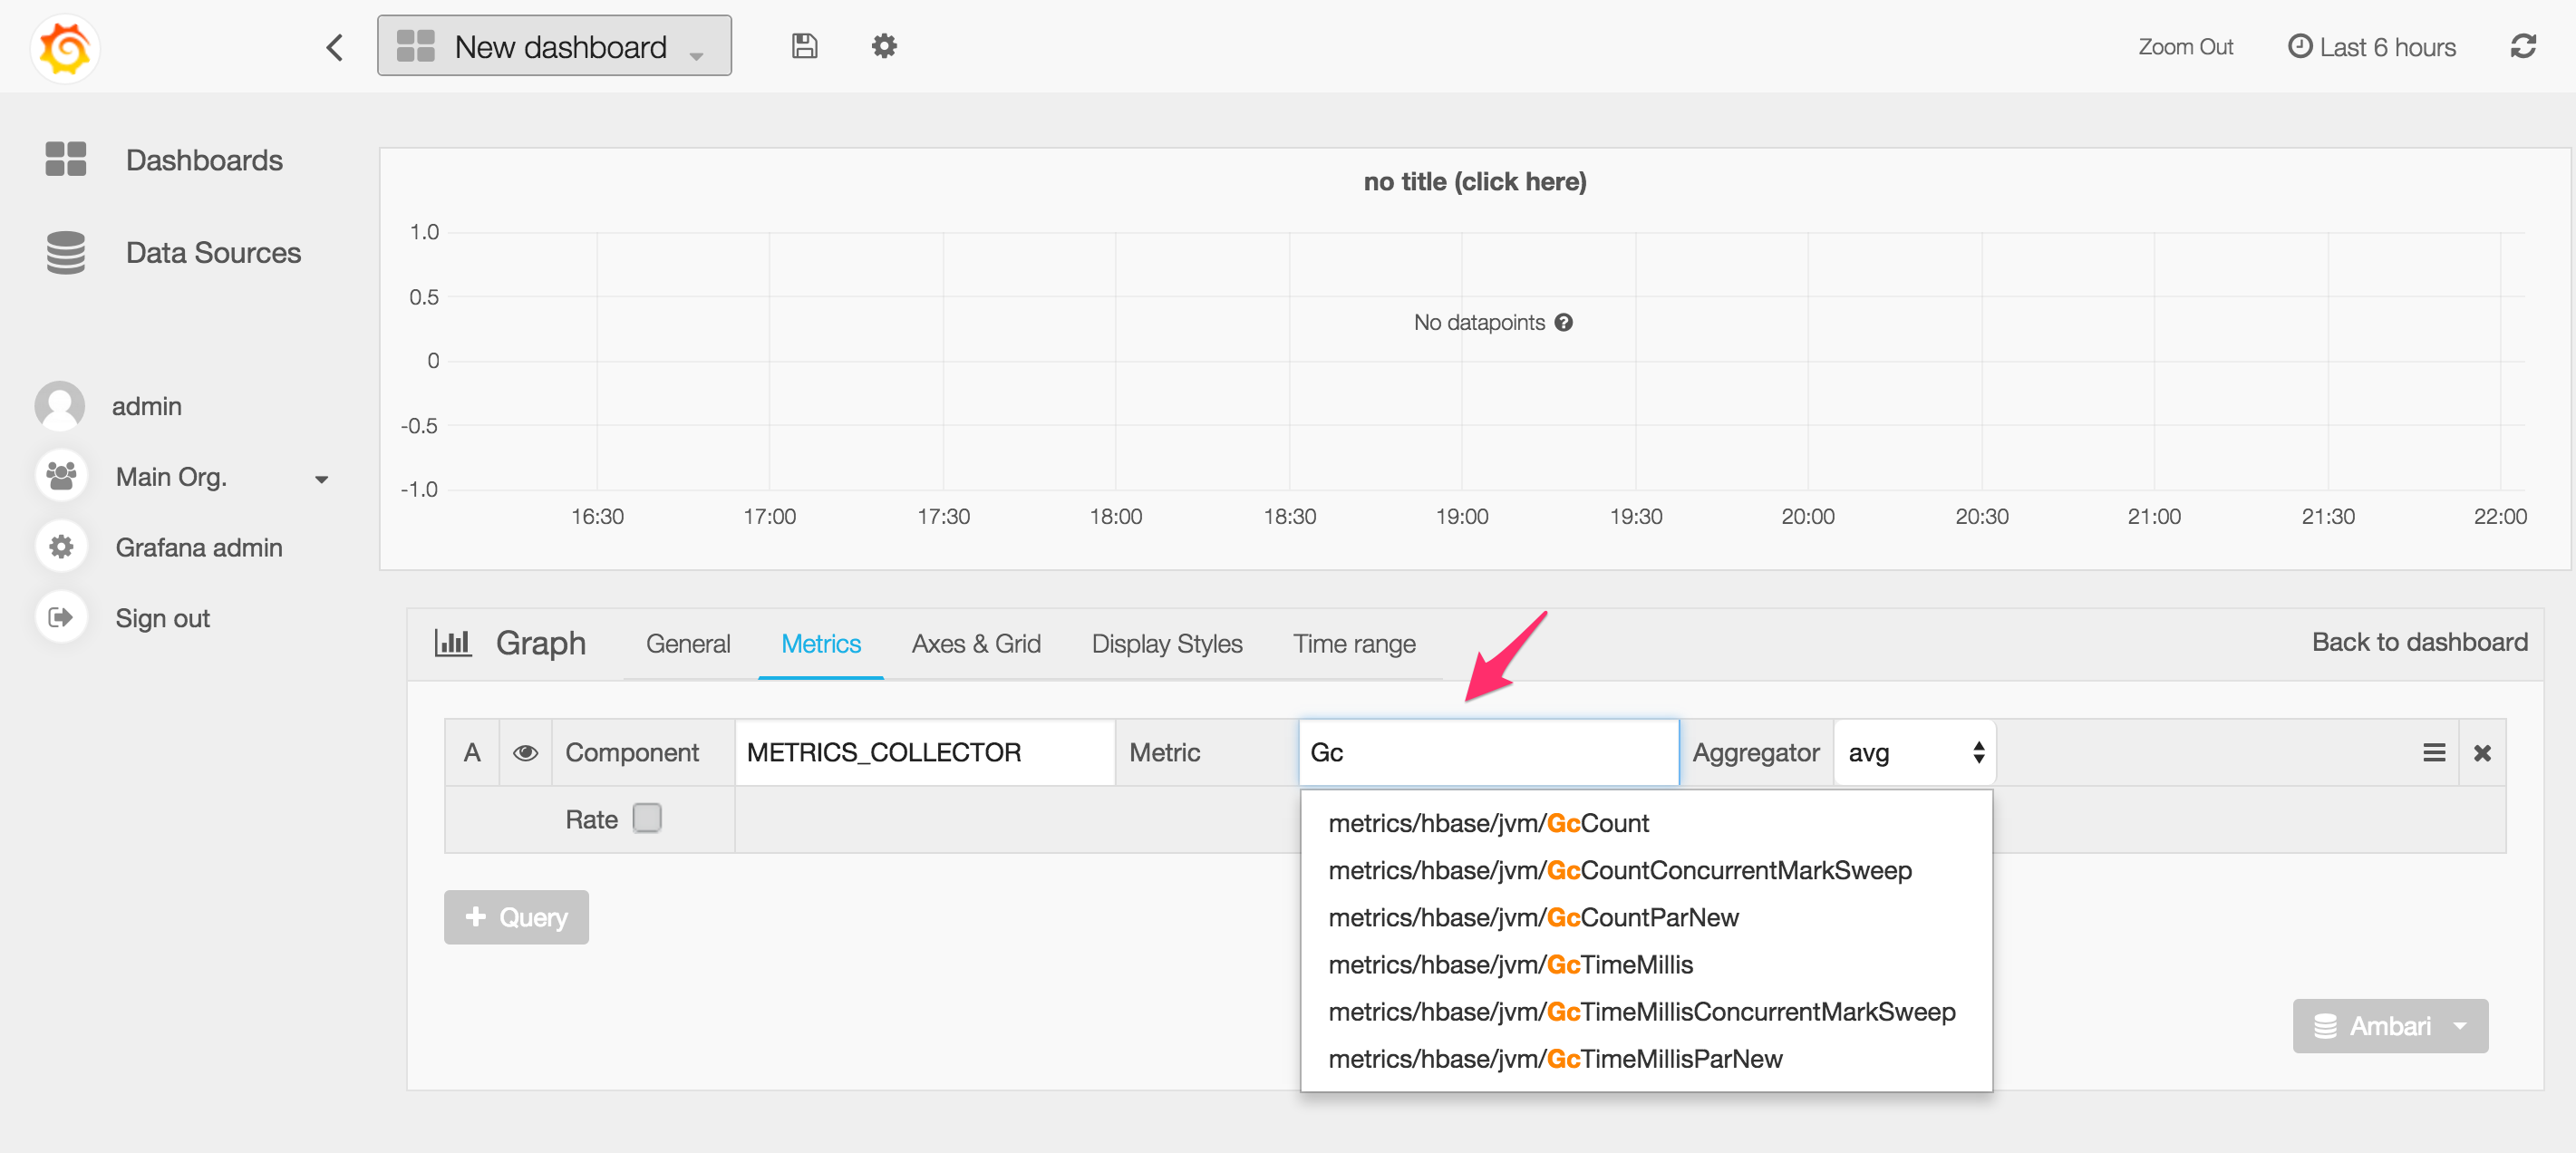
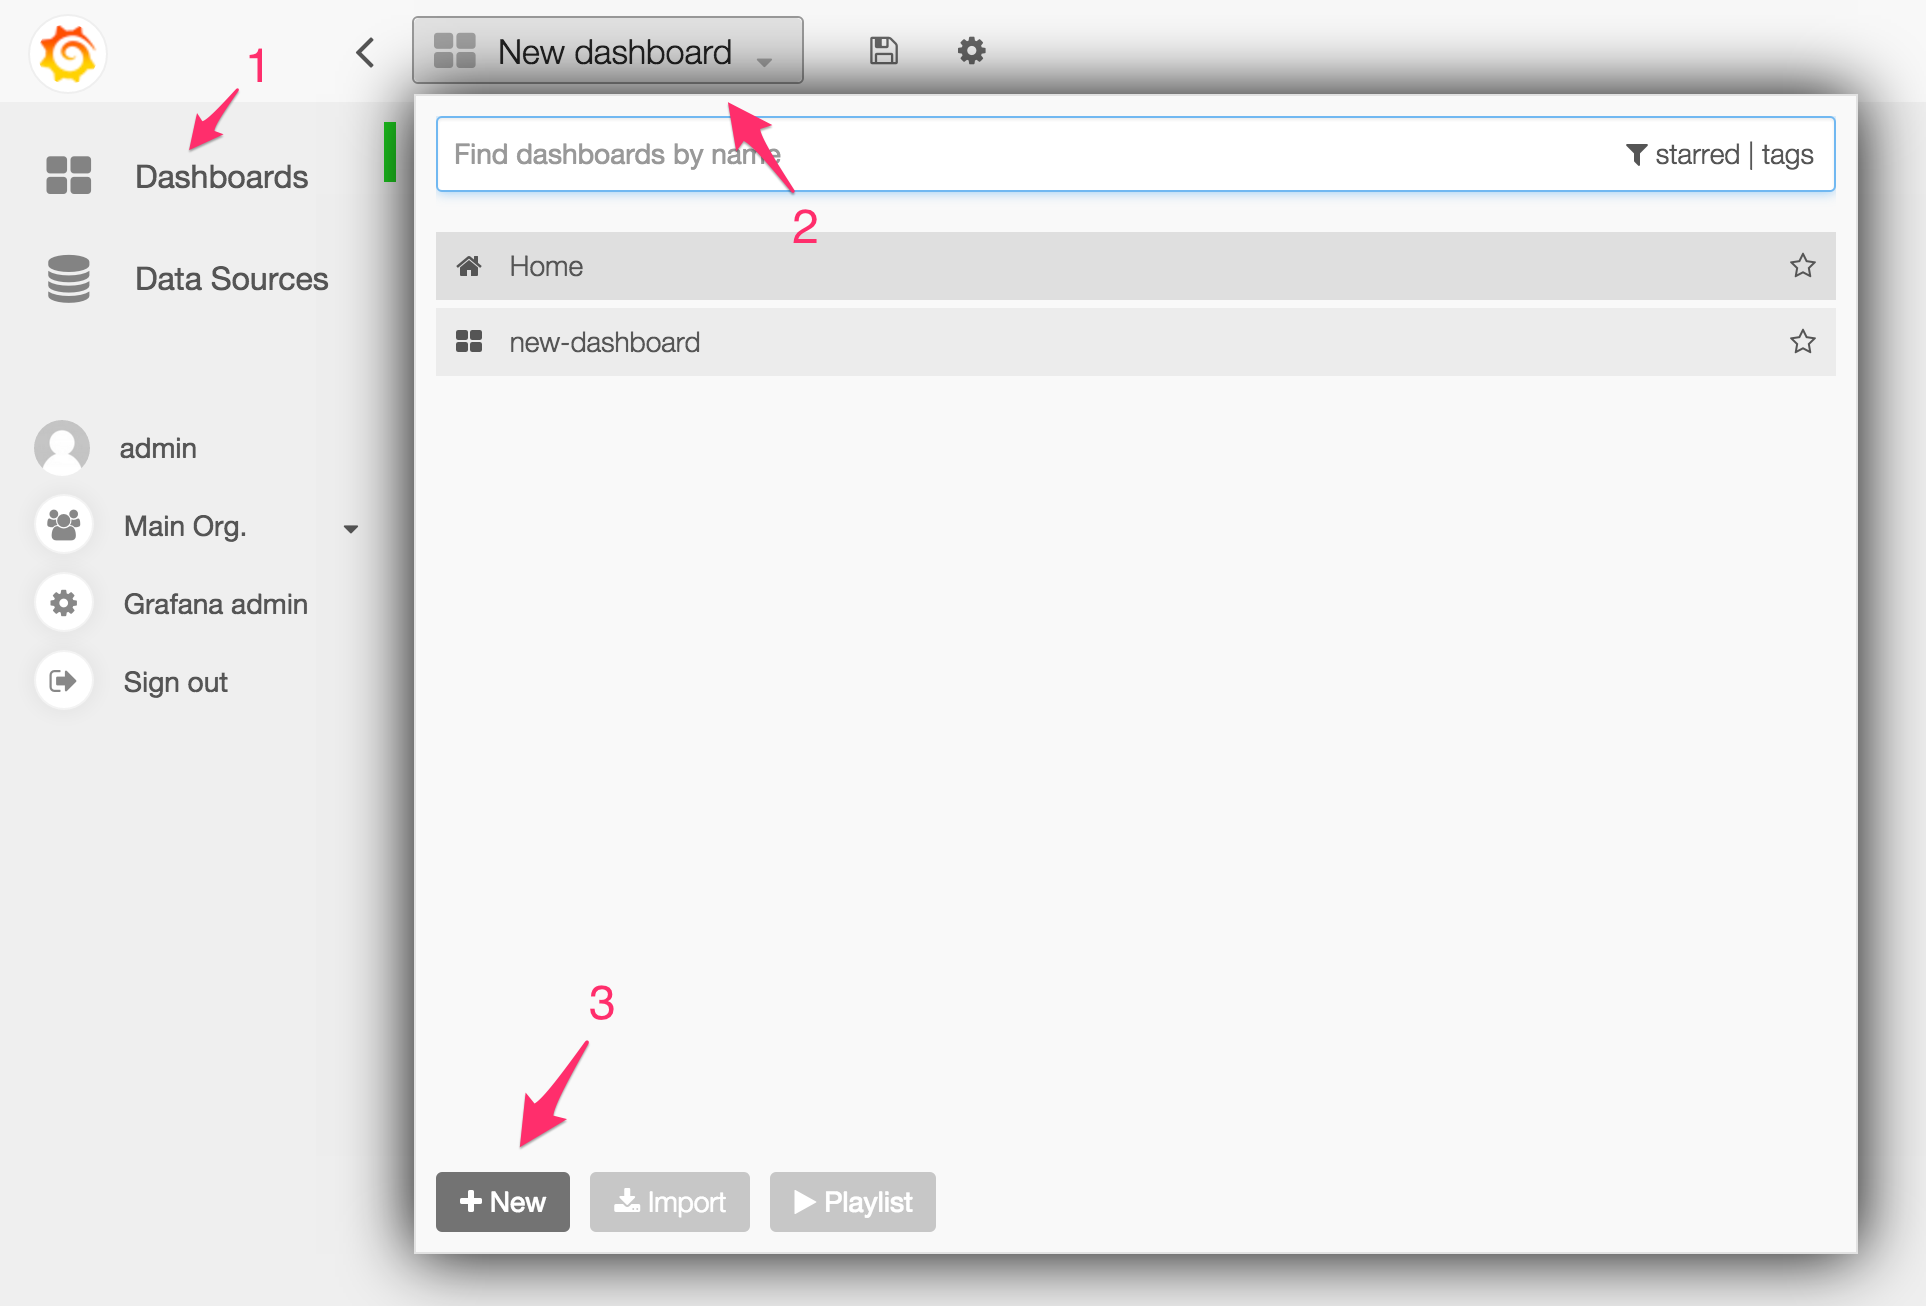
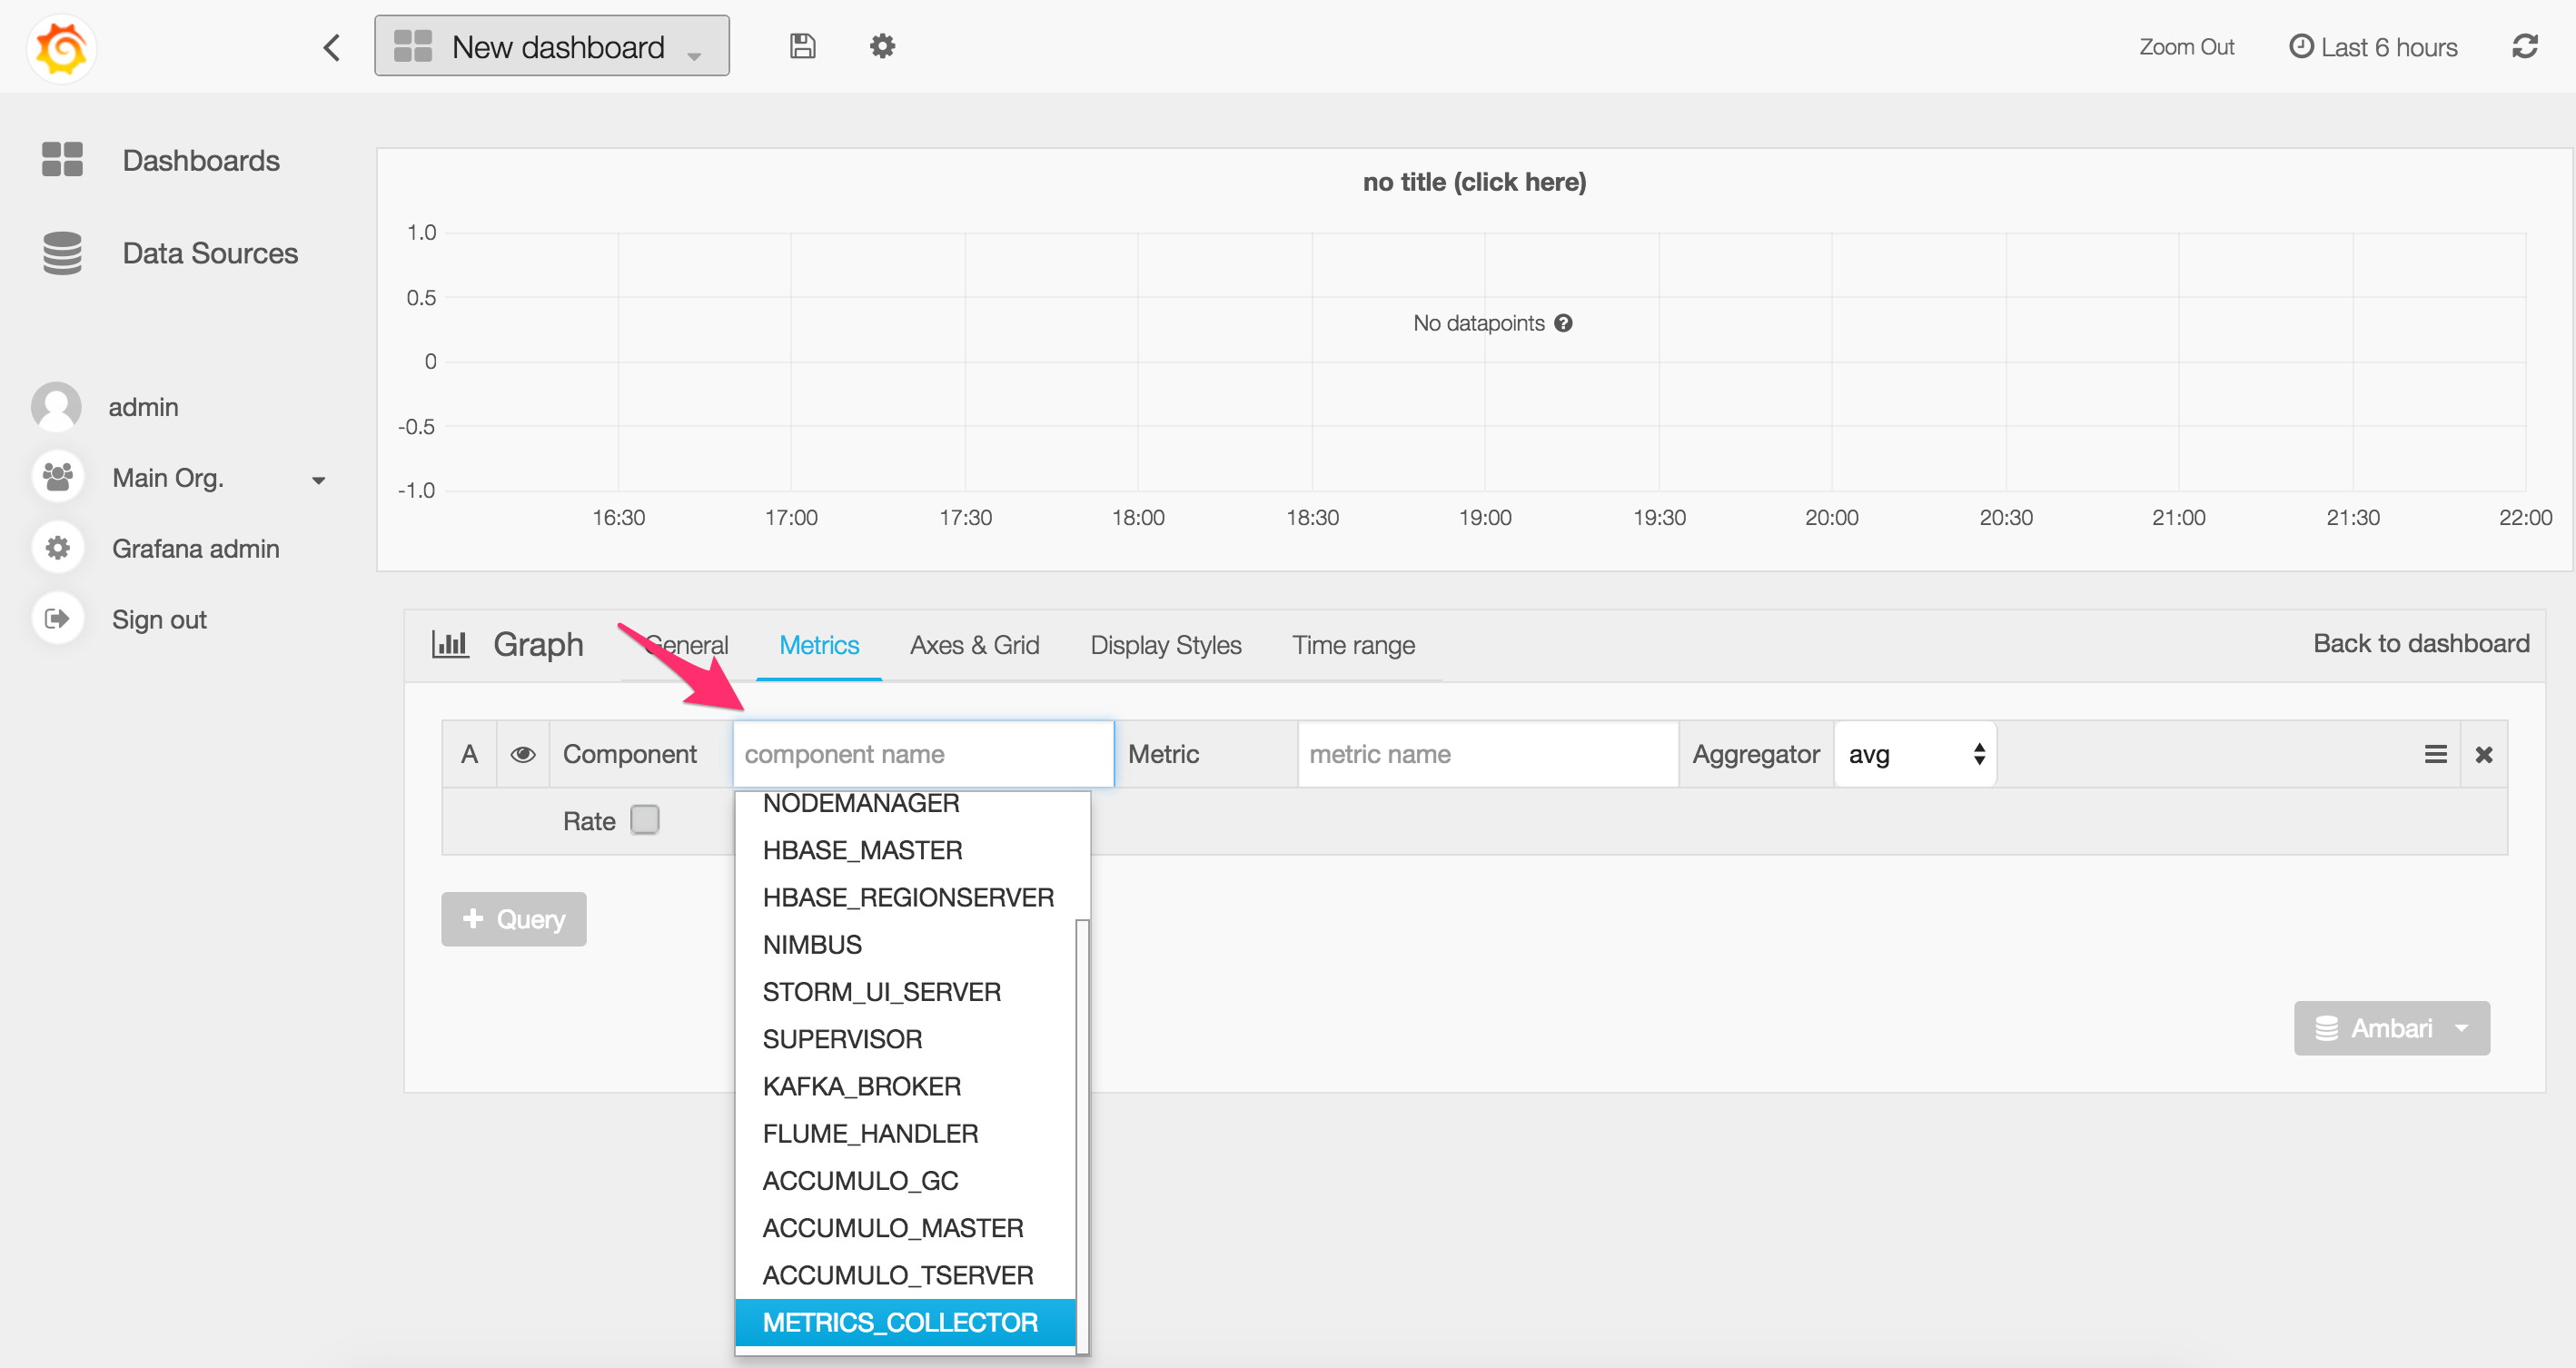
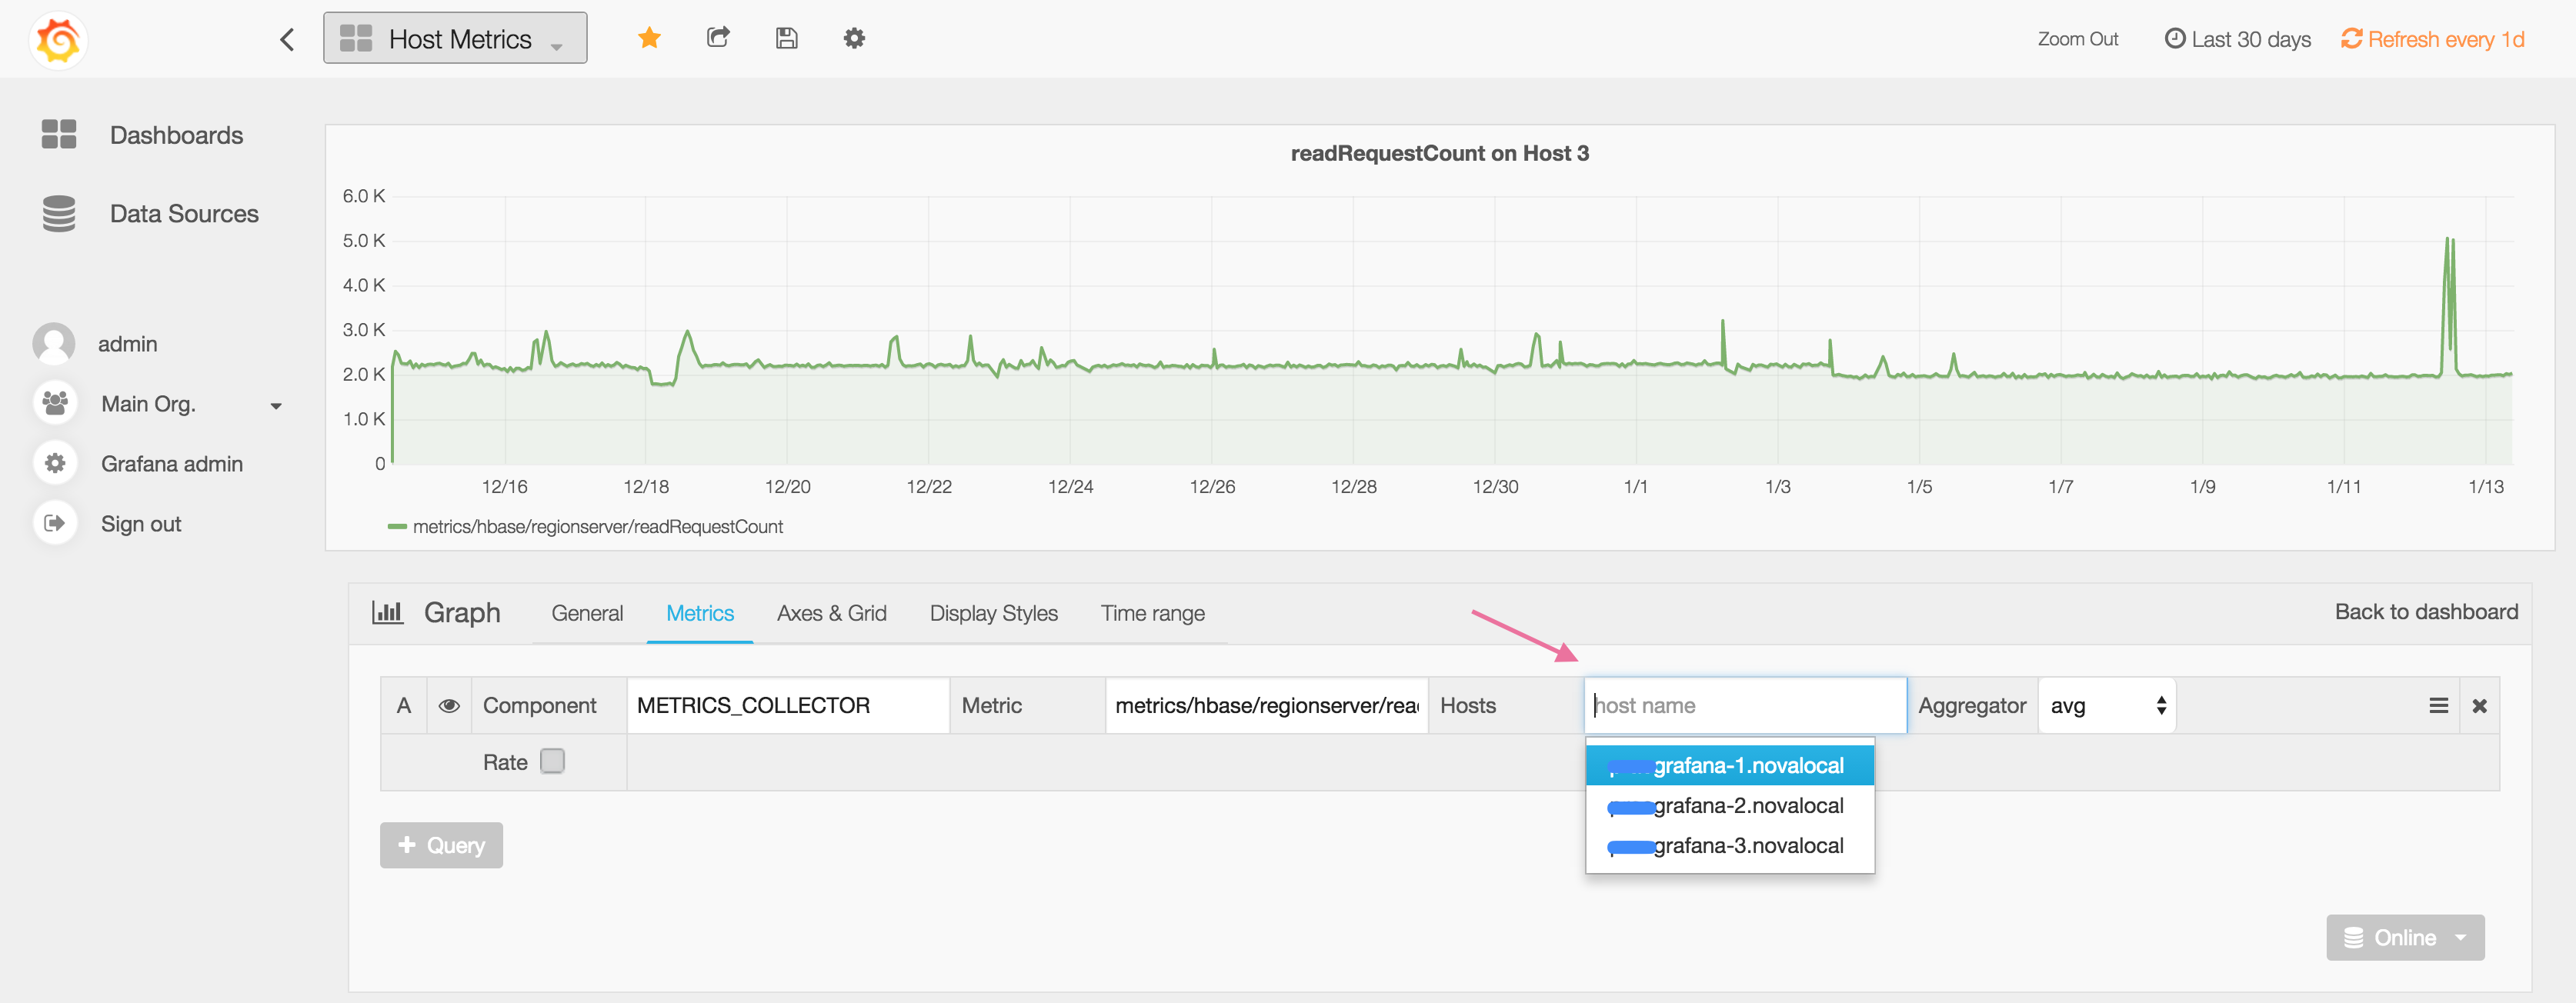
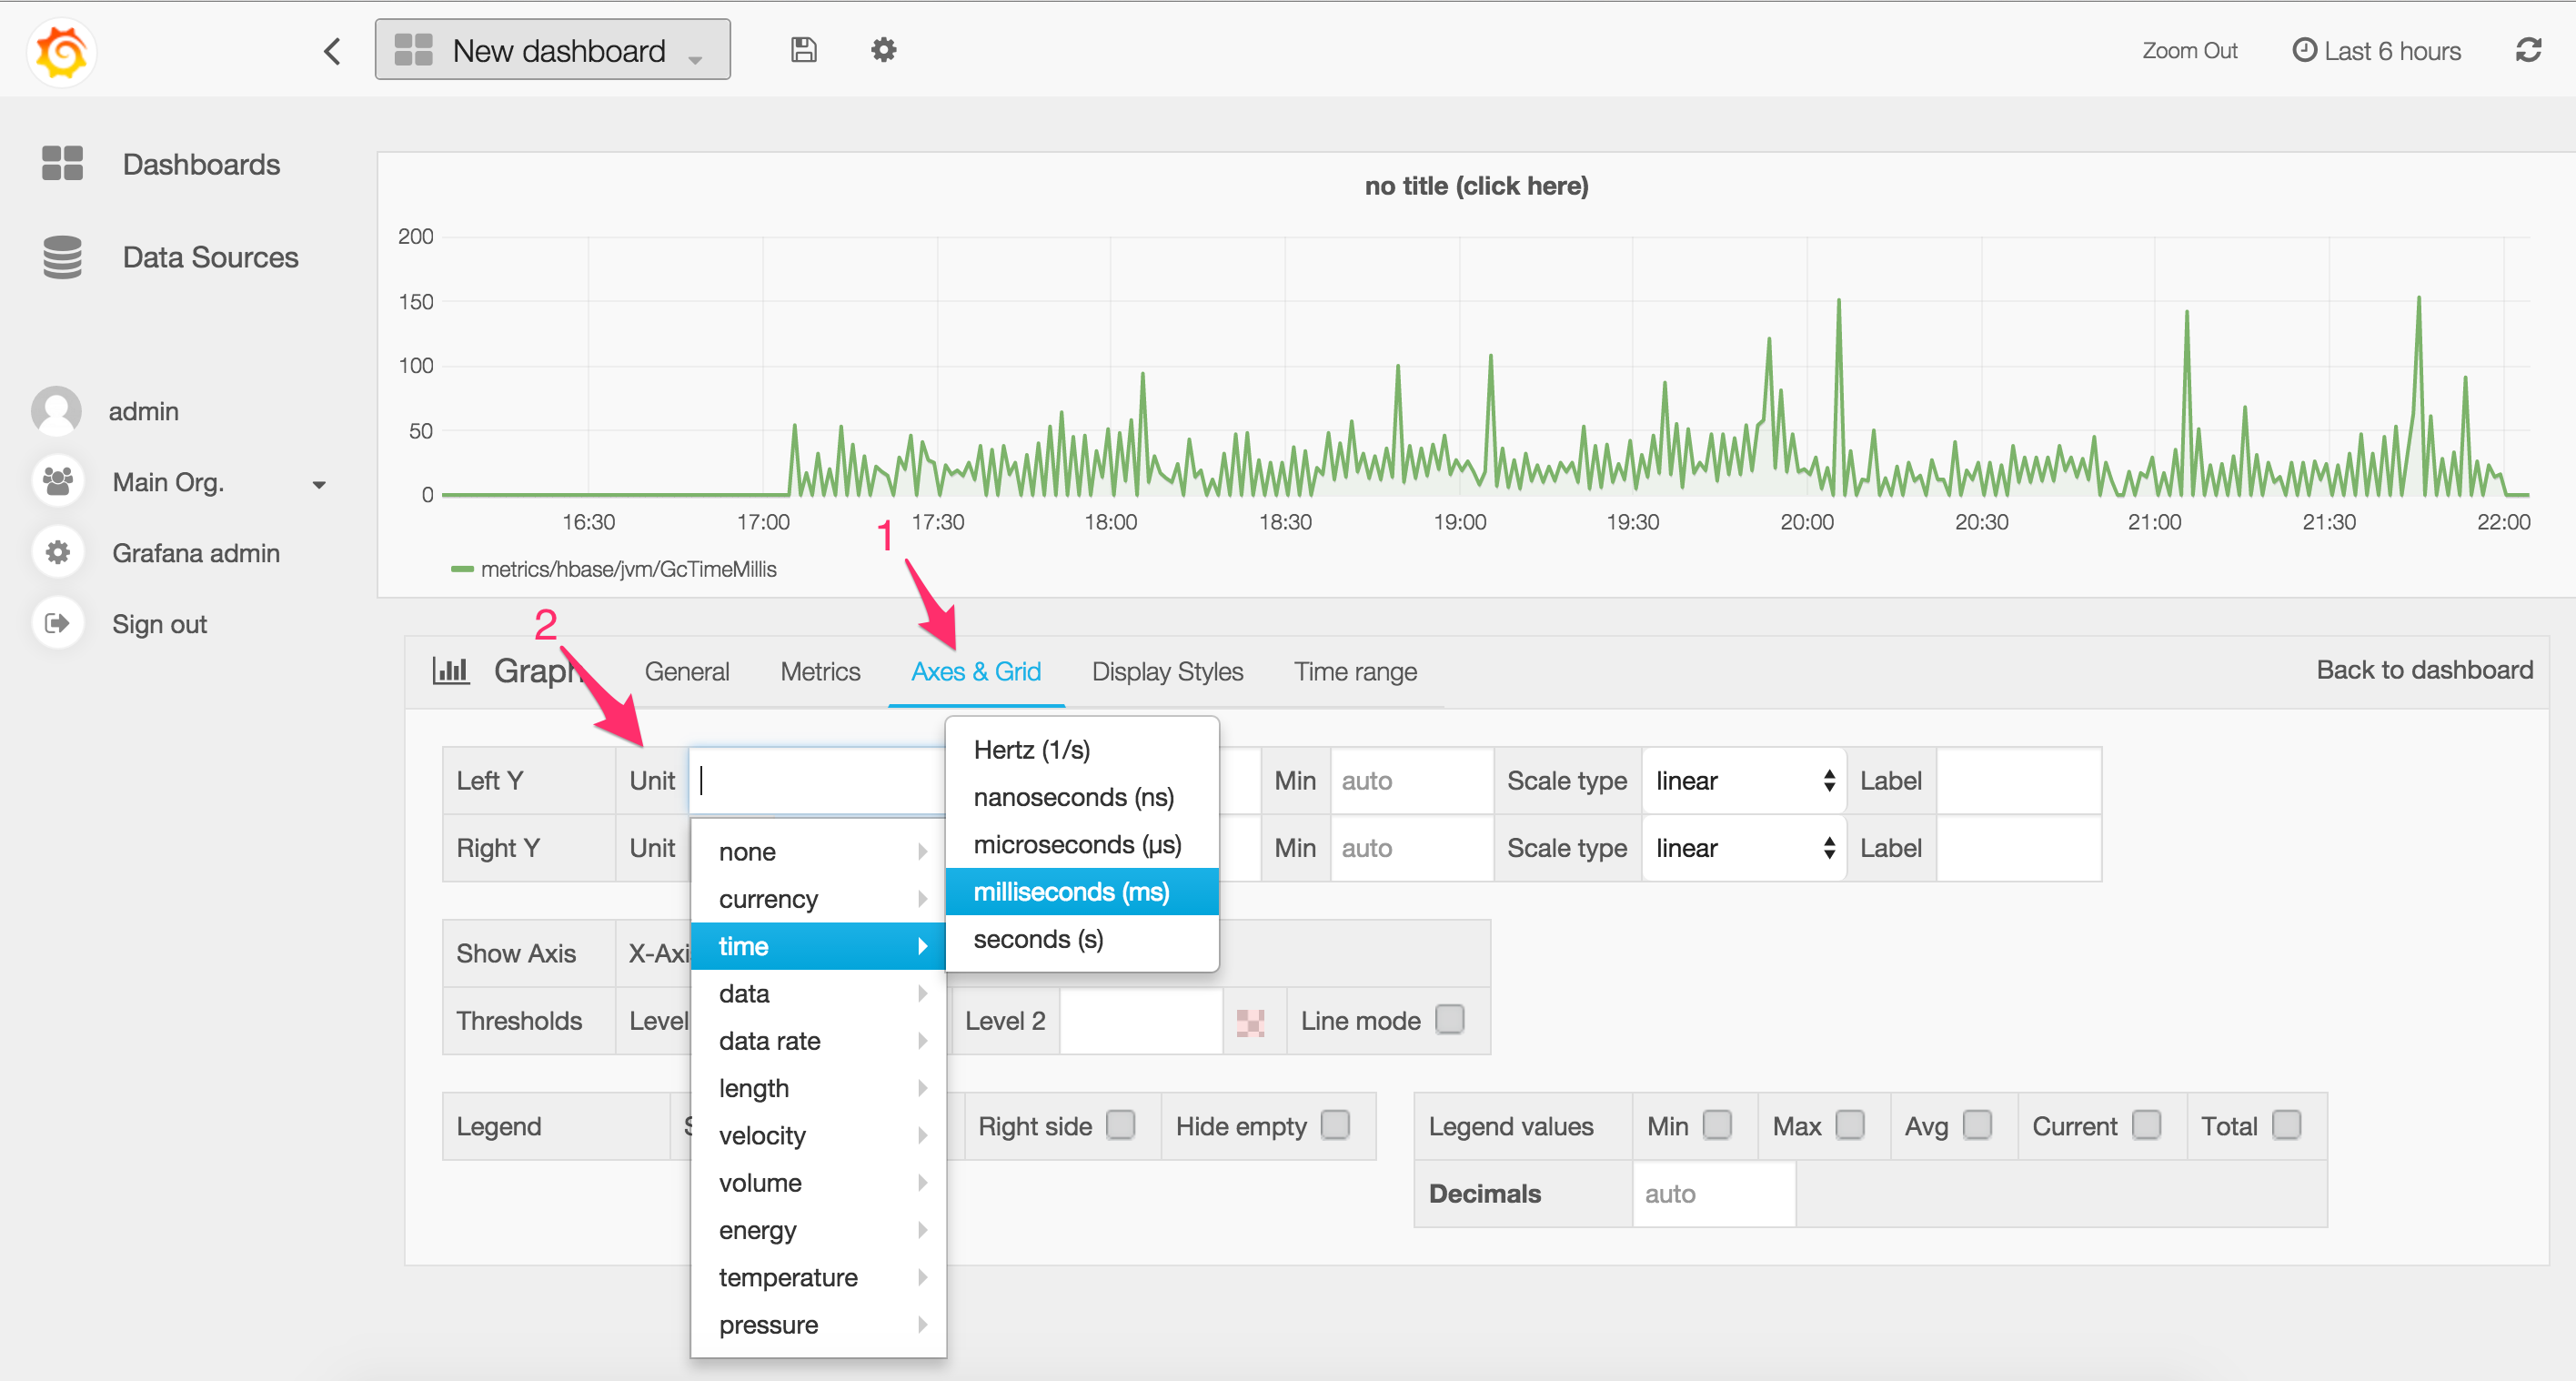
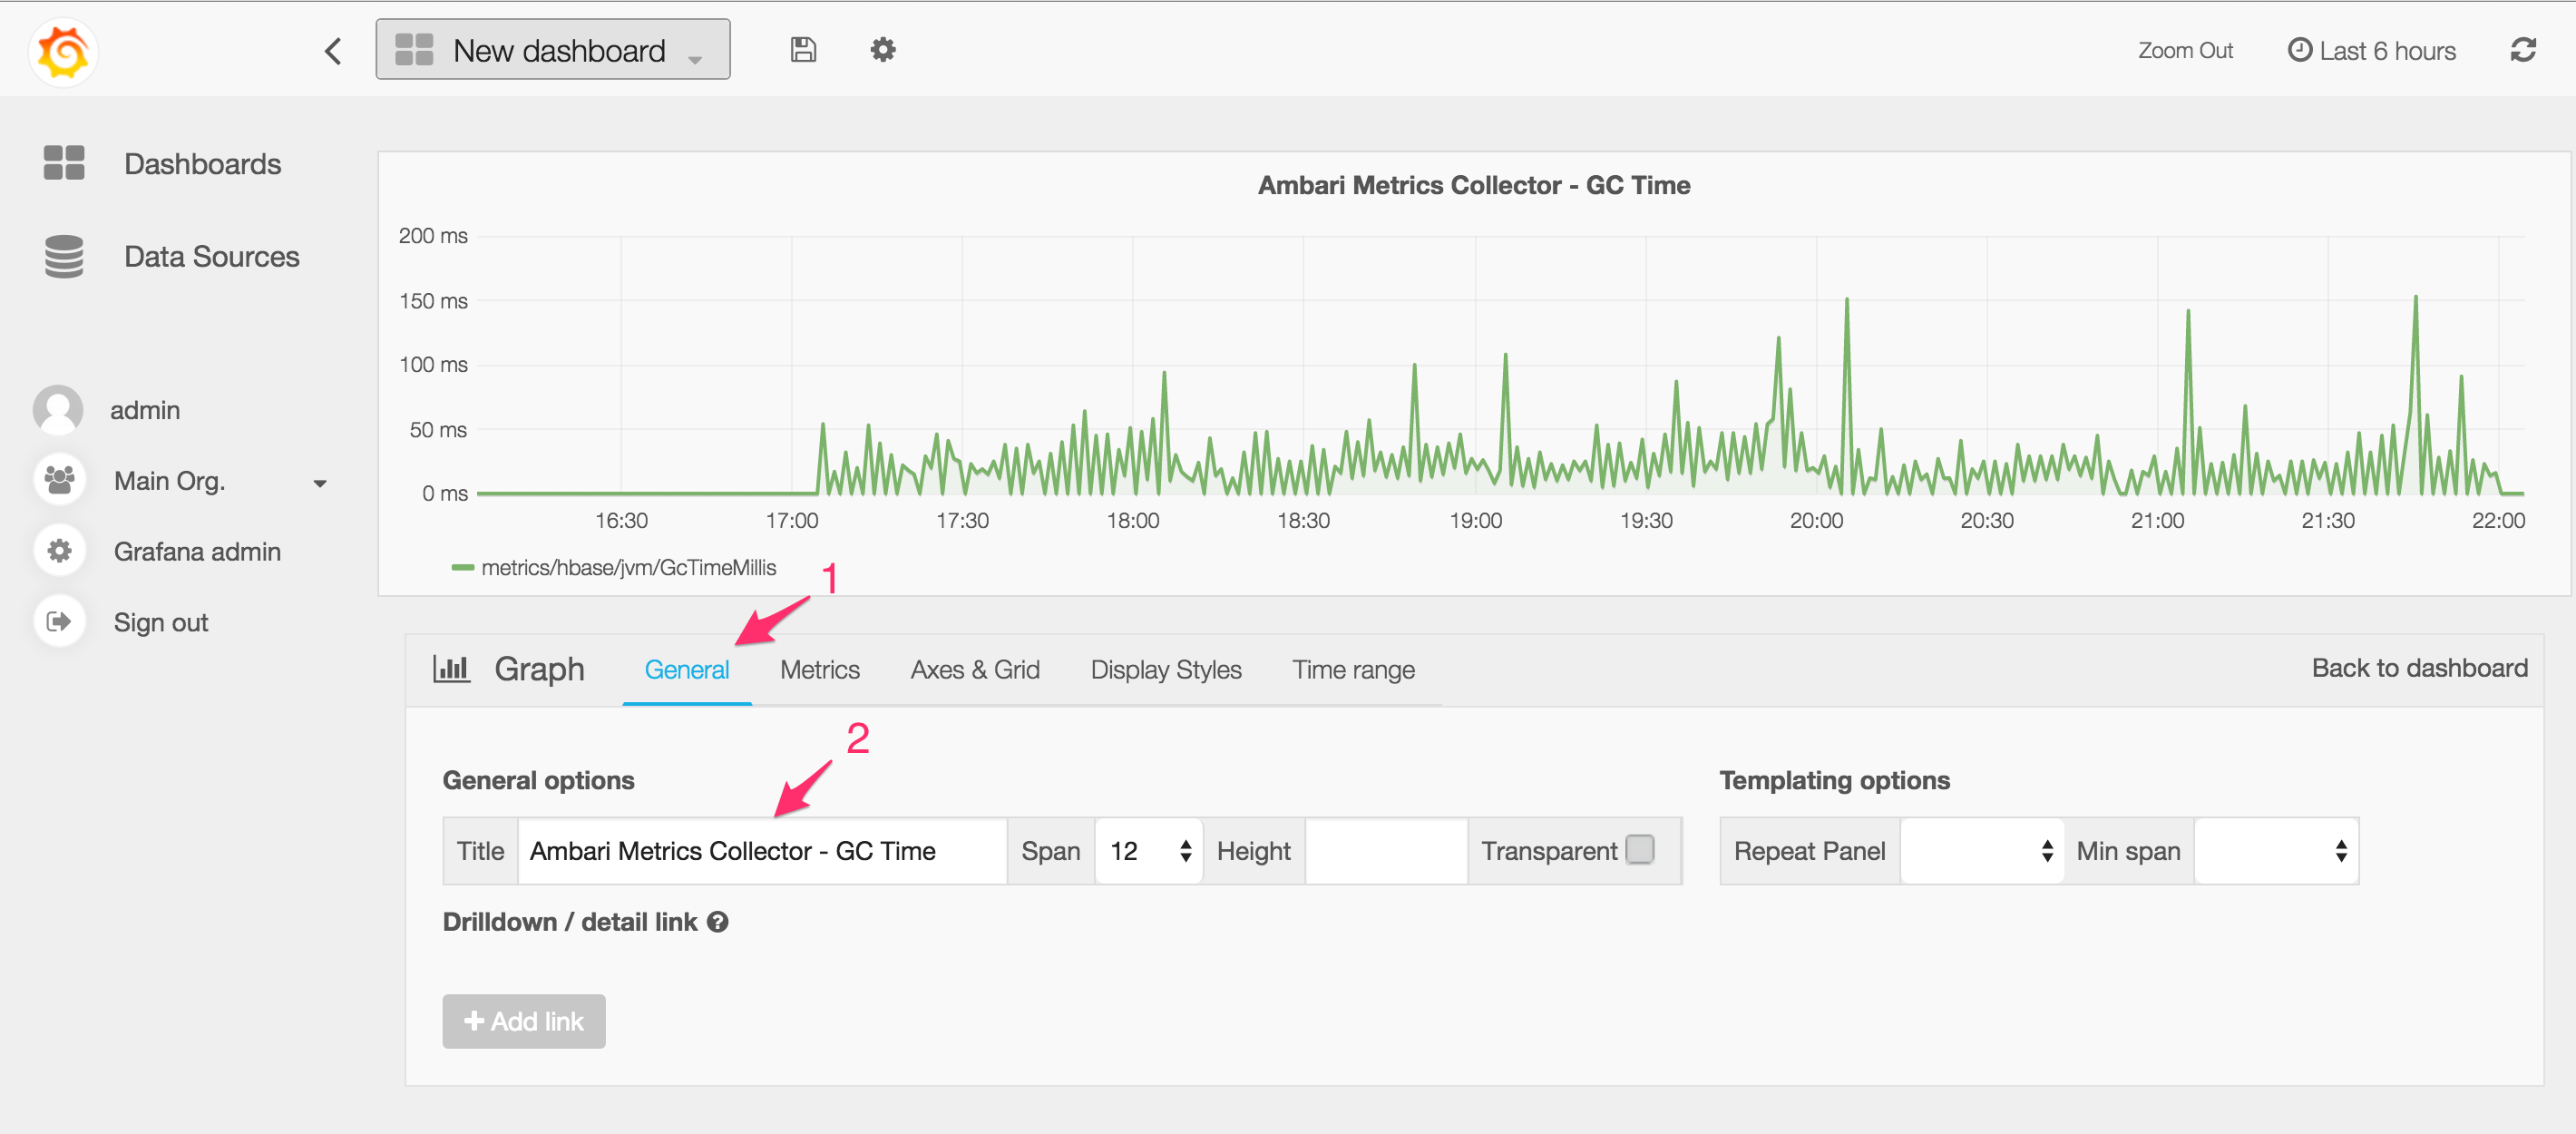
Grafana UI can be a little tricky to get used to. Here's a walk through of how to create a dashboard and add a graph to it.
