Hurricane Sandy will always be remembered for its devastating affects through several states across the northeastern United States.
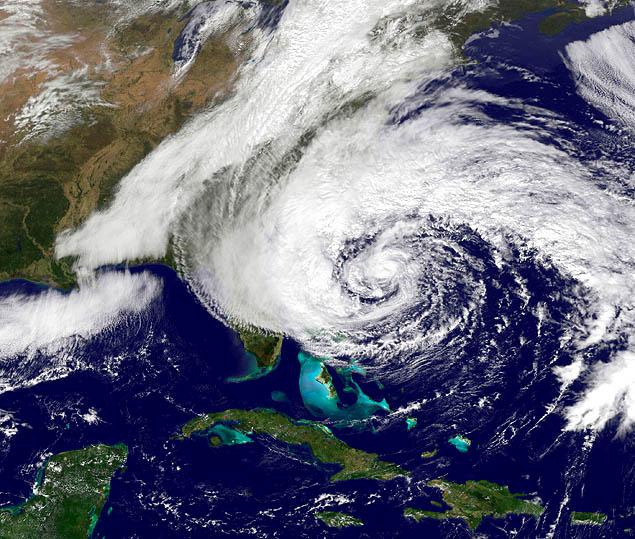
Sandy was formed 500 kilometers southwest of Kingston, Jamaica, on October 22, 2012, at 12:00 am UTC. It grew in size and re-intensified as it moved northeast along the US coast, reaching maximum wind speeds of 85 knots at 12:00 am UTC on October 29, roughly 350 kilometers southeast of Atlantic City. Sandy deteriorated to a post-tropical storm the next day and made landfall near Brigantine, New Jersey, at 23:30 UTC on October 29. The wind reached 70 knots at landfall, while the storm surge peaked up to 3.85 meters along with the New Jersey and New York coasts. The storm surge caused the majority of the damage to homes, with up to 650,000 homes damaged. In some areas, power outages persisted for weeks, affecting almost 8.5 million people.

The flooding rumor about the New York Stock Exchange (NYSE), which claimed that the trading floor was inundated with more than 3 feet of water, is spread widely on Twitter. The rumor made its way to CNN, where meteorologist Chad Myers announced that the NYSE was under 3 feet of water, citing the National Weather Service as a source.

This research conducts a case study of rumors about the New York Stock Exchange flooding and its corrections on Twitter during Hurricane Sandy. We first examined the relationship between spatiotemporal proximity, disaster misinformation sharing, and misinformation corrections. Second, we explored how social, spatial, and temporal distances influence sharing of misinformation and sharing of corrections on Twitter. Third, based on the social network analysis, we identified the influential rumor spreaders and influential users in correcting the rumor. We further compared the demographic information of identified influential users. Fourth, we performed the sentiment analysis to visualize the sentiment contagion across the rumor network and the correction network.
Our findings facilitate disaster management through the lens of misinformation and the effectiveness of correction efforts.
Connections among social media users can be reflected with multiple relations. One of the most straightforward indicators is follower-followee relationships. However, users often are following hundreds of thousands of users, whose tweeting frequencies vary significantly. Instead, retweeting or mentioning activities requires more active actions of users, and therefore is considered a better connection between users. Since retweets include the original author’s username, annotated by “@”, in this study we consider retweeting as a sub-group of mentioning.
Based on the retweeting and "@" records, we build up information dissemination relationships in Twitter. Thus, we could build dissemination networks based on these relationships, and visualize them. Based on the Girvan-Newman algorithm, we originally identified 255 communities from the misinformation dissemination network and 113 communities for the correction message dissemination network.
<iframe width="640" height="600" src="https://yuh2k.github.io/Disaster-misinformation-and-its-correction-on-social-media/Misinformation%20Network/ " frameborder="0" allow="accelerometer; autoplay; encrypted-media; gyroscope; picture-in-picture" allowfullscreen></iframe> Visualization of misinformation's dissemination <iframe width="640" height="600" src="https://yuh2k.github.io/Disaster-misinformation-and-its-correction-on-social-media/Correction%20Network/" frameborder="0" allow="accelerometer; autoplay; encrypted-media; gyroscope; picture-in-picture" allowfullscreen></iframe> Visualization of correction information's disseminationBelow figure shows that the dissemination rate of misinformation and corrections are strongly related to the timing of hurricane landfall. Specifically, the number of misinformation and corrections slowly increase before a sharp increase on the day of hurricane landfall, followed by a gradual decline. The horizontal axis is an offset (in hours) concerning the time of hurricane landfall (00:00 UTC on 30 October 2012).

These two videos demonstrate how two dissemination networks grew by time. An overt "connecting outbreak" between nodes could be noticed from one specific time stage.
(Time range: 344 hours before the landing of Sandy, to 239 hours after it)
<iframe width="640" height="360" src="https://www.youtube.com/embed/Pa_hXfgaumM" title="YouTube video player" frameborder="0" allow="accelerometer; autoplay; clipboard-write; encrypted-media; gyroscope; picture-in-picture" allowfullscreen></iframe> Misinformation transmission network <iframe width="640" height="360" src="https://www.youtube.com/embed/z0NFjOD0tSU" title="YouTube video player" frameborder="0" allow="accelerometer; autoplay; clipboard-write; encrypted-media; gyroscope; picture-in-picture" allowfullscreen></iframe> Correction information transmission networkIdentifying sentiment expressed by social media users can help understand the users’ main concerns, panics, and psychological impacts during an emergency. Previous studies have demonstrated that sentiment in Twitter reflects spatial-temporal mood variations and is indicative of damage suffered during natural disasters. However, an important question remains if Twitter users also differ in their emotional response when they spread misinformation or correct misinformation.
To study this, we applied a rule-based model VADER. Specifically, each tweet can be assigned with a normalized sentiment score ranging from −1 to 1. Three sentiment polarities can be defined according to the normalized sentiment score as following:
positive sentiment: normalized sentiment > = 0.05;
neutral sentiment: −0.05 < normalized sentiment < 0.05;
negative sentiment: normalized sentiment <= −0.05.
In addition, we also employed TextBlob as a complementary method to calculate the sentiment index of each user, which has also been used in the existing studies.
In our analysis, we applied different sentiment measurements to gauge the sentiment score of each misinformation tweet or correction tweet. Below figures illustrate the relationship between distance to hurricane landfall location, the number of rumor/correction tweets, and the sentiment score.

We further visualized the sentiment contagion network to understand how influential users’ sentiments spread through the rumor network and the correction network, respectively. First, for the rumor network, it is quite consistent that individuals in the same community often hold the same attitude toward the rumor. Moreover, most of the communities in the rumor network are expressing neutral sentiments since the rumor itself is a neutral statement. Surprisingly, some communities exhibit positive sentiments while the rumor could cause serious consequences.

We also extracted the frequency of the keywords that appeared most in TOP 10 influential community to generate word clouds. We could notice that different communities produce different distribution of keywords.

