Memory Monitoring
Memory shortage is often the cause of instability and **unresponsiveneness **in Java applications. Consequently, we need to monitor the impact of garbage collection on response time and memory usage to ensure both stability and performance. However, monitoring memory utilization and garbage collection times is not enough, as these two elements alone do not tell us if the application response time is affected by garbage collection. Only GC suspensions affect response time directly, and a **GC **can also run concurrent to the application. We therefore need to correlate the suspensions caused by garbage collection with the application’s response time. Based on this we need to monitor the following:
- Utilization of the different memory pools (Eden, Survivor and old generation). Memory shortage is the number-one reason for increased GC activity
- If overall memory utilization is increasing continuously despite garbage collection, there is a memory leak, which will inevitably lead to an out-of-memory. In this case, a memory heap analysis is necessary
- The number of young generation collections provides information on the churn rate (the rate of object allocations). The higher the number, the more objects are allocated. A high number of young collections can be the cause of a response-time problem and of a growing old generation (because the young generation cannot cope with the quantity of objects anymore)
- If the utilization of old generation fluctuates greatly without rising after GC, then objects are being copied unnecessarily from the young generation to the old generation. There are three possible reasons for this: the young generation is too small, there is high churn rate or there is too much transactional memory usage
- High GC activity generally has a negative effect on CPU usage. However, only suspensions (stop-the-world-events) have a direct impact on response time. Contrary to the popular opinion, suspensions are not limited to Major GCs. It is therefore important to monitor suspensions in correlation to application response time
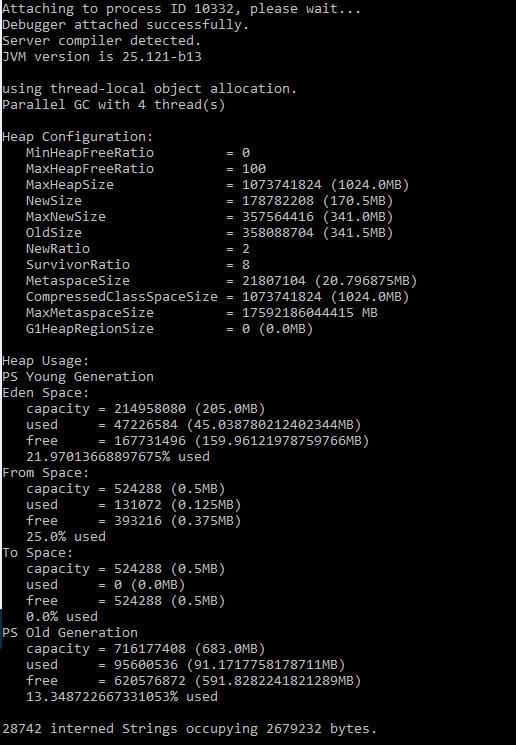
The jstat utility uses the built-in instrumentation in the Java HotSpot VM to provide information about the performance and resource consumption of running applications. The tool can be used when diagnosing performance issues, and in particular issues related to heap sizing and garbage collection. The jstat utility does not require the VM to be started with any special options. The built-in instrumentation in the Java HotSpot VM is enabled by default. This utility is included in the JDK download for all operating systems. The jstat utility uses the virtual machine identifier (VMID) to identify the target process.
Using jstat command with gc option to find out the JVM Heap Memory usage.
**<JAVA_HOME>/bin/jstat –gc <JAVA_PID>**
Result Points are
- S0C Current survivor space 0 capacity (KB)
- S1C Current survivor space 1 capacity (KB)
- S0U Survivor space 0 utilization (KB)
- S1U Survivor space 1 utilization (KB)
- EC Current eden space capacity (KB)
- EU Eden space utilization (KB)
- OC Current old space capacity (KB)
- OU Old space utilization (KB)
- MC Metasapce capacity (KB)
- MU Metaspace utilization (KB)
- CCSC Compressed class space capacity (KB)
- CCSU Compressed class space used (KB)
- YGC Number of young generation garbage collection events
- YGCT Young generation garbage collection time
- FGC Number of full GC events
- FGCT Full garbage collection time
- GCT Total garbage collection time
The jmap utility prints the memory-related statistics for a running VM or core file. JDK 8 introduced Java Mission Control, Java Flight Recorder and jcmd utility for diagnosing problems with JVM and Java applications. It is suggested to use the latest utility, jcmd instead of jmap utility for enhanced diagnostics and reduced performance overhead.
The –heap option can be used to obtain the following Java heap information:
- Information specific to the GC algorithm, including the name of GC algorithm (for example, parallel GC) and algorithm-specific details (such as number of threads for parallel GC).
- Heap configuration that might have been specified as command-line options or selected by the VM based on the machine configuration.
- Heap usage summary: For each generation (area of the heap), the tool prints the total heap capacity, in-use memory, and available free memory. If a generation is organized as a collection of spaces (for example, the new generation), then a space specific memory size summary is included.
**<JAVA_HOME>/bin/jmap –heap <JAVA_PID>**
The jcmd utility is used to send diagnostic command requests to the JVM, where these requests are useful for controlling Java Flight Recordings, troubleshoot, and diagnose JVM and Java applications. It must be used on the same machine where the JVM is running, and have same effective user and group identifiers that were used to launch the JVM.
A heap dump (hprof dump) can be created using the following command: jcmd <JAVA_PID> GC.heap_dump filename=
The above command is same as using jmap –dump:file= <JAVA_PID> But jcmd is recommended tool to use.
jhat The jhat tool provides a convenient means to browse the object topology in a heap snapshot. This tool replaces the Heap Analysis Tool (HAT). The tool parses a heap dump in binary format (for example, a heap dump produced by jcmd). This utility can help debug unintentional object relation. This term is used to describe an object that is no longer needed but is kept alive due to references through some path from the rootset. This can happen, for example, if an unintentional static reference to an object remains after the object is no longer needed, if an observer or listener fails to unregister itself from its subject when it is no longer needed, or if a thread that refers to an object does not terminate when it should. Unintentional object relation is the Java language equivalent of a memory leak. We can analyze heap dump using jhat with the following command
jhat <HPROF_FILE>
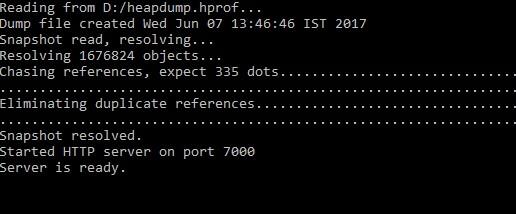
When we are connected to the server using http://localhost:7000, we can execute a standard query or create an Object Query Language (OQL). The All Classes query is displayed by default. This default page displays all of the classes present in the heap, excluding platform classes. This list is sorted by fully qualified class name, and broken out by package. Click the name of a class to go to the Class query. The second variant of this query includes the platform classes. Platform classes include classes whose fully qualified names start with prefixes such as java, sun or javax.swing. On the other hand, the class query displays the information about a class. This includes its superclass, any subclasses, instance data members, and static data members. From this page you can navigate to any of the classes that are referenced, or you can navigate to an instance query. The instance query displays all instances of a given class.
HPROF is a tool for heap and CPU profiling shipped with every JDK release. It is a dynamic-link library (DLL) that interfaces with the JVM using the Java Virtual Machine Tool Interface (JVMTI). The tool writes profiling information either to a file or to a socket in ASCII or binary format. The HPROF tool is capable of presenting CPU usage, heap allocation statistics, and monitor contention profiles. In addition, it can report complete heap dumps and states of all the monitors and threads in the JVM. In terms of diagnosing problems, HPROF is useful when analyzing performance, lock contention, memory leaks and other issues.
We can invoke the HPROF tool using:
java –agentlib:hprof ToBeProfiledClass
java –agentlib:hprof=heap=sites ToBeProfiledClass
Depending on the type of profiling requested, HPROF instructs the JVM to send it the relevant events. The tool then processes the event data into profiling information. By default, heap profiling information is written out to java.hprof.txt (in ASCII) in the current working directory.
The following command
javac –J-agentlib:hprof=heap=sites Hello.java
can be used to obtain heap allocation profile. A crucial piece of information in the heap profile is the amount of allocation that occurs in various parts of the program.
Similarly, a heap dump can be obtained using heap=dump option. The output of
javac –J-agentlib:hprof=heap=dump Hello.java
consists of the root set as determined by the garbage collector, and an entry for each Java object in the heap that can be reached from the root set.
The HPROF tool can collect CPU usage information by sampling threads.
The following command can be used to get the CPU usage sampling profile results:
javac –J-agentlib:hprof=cpu=samples Hello.java
The HPROF agent periodically samples the stack of all running threads to record the most frequent active stacktraces.
There are other tools such as VisualVM which provides us the detailed information of memory usages, garbage collections, heap dumps, CPU and memory profiling etc. in the form of GUI.
VisualVM is a tool derived from the NetBeans platform and its architecture is modular in design meaning it is easy to extend through the use of plugins. VisualVM allows us to get detailed information about Java applications while they are running on a JVM and it can be in a local or a remote system. Data generated can be retrieved using Java Development Kit (JDK) tools and all the data and information on multiple Java applications can be viewed quickly for both local and remote running applications. It is also possible to save and capture the data about the JVM software and save data to the local system. VisualVM can do CPU sampling, memory sampling, run garbage collections, analyze heap errors, take snapshots and more.
We can enable the JMX remote ports by adding the following system properties while starting the Java application:
- -Dcom.sun.management.jmxremote
- -Dcom.sun.management.jmxremote.port=
- -Dcom.sun.management.jmxremote. We can now use VisualVM to connect to the remote machine and view the CPU utilization, memory sampling, threads etc. We can also generate thread dumps and memory dumps on the remote machine when connected through JMX Remote port.
Below figure shows a list of applications that are running on local and on remote systems. To connect to a remote system, right click on “Remote” and add a host name and under Advanced Settings, define the port which was used when starting the application on the remote machine. Once there are applications listed under local or remote section, double click on them to view the details of the application.
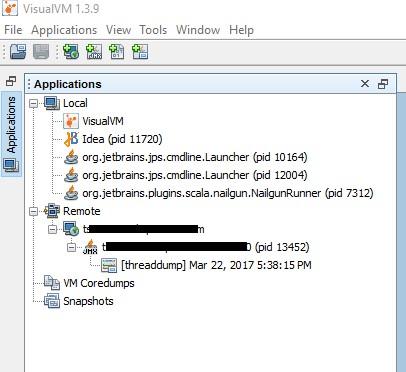
There are four tabs for the details of the application: Overview, Monitor, Threads and Sampler.
The **Overview **tab contains main information about the launched application. The main class, the arguments of the command line, JVM arguments, PID, system properties and any saved data such as thread dumps or heap dumps are available in the overview tab.
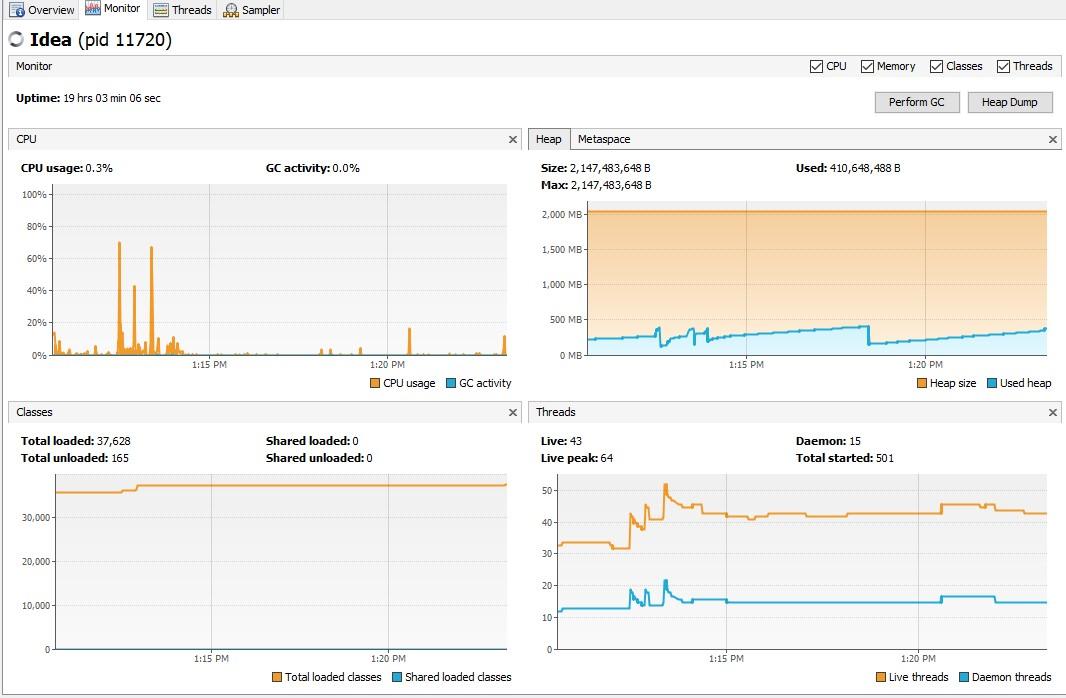
The interesting tab is the **Monitor **tab. This tab displays the CPU and memory usage of the application. There are four graphs in this view.
References